Debugging is the process of finding and resolving defects or problems within a computer program that prevents the correct operation of computer software or a system.
This is more for my memory that anything else but I thought I'd share it because it often comes up in comments, but is not in the InterSystems documentation.
There is a wonderful utility called ^REDEBUG that increases the level of logging going into mgr\cconsole.log.
The %Net.SSH.Session class lets you connect to servers using SSH. It's most commonly used with SFTP, especially in the FTP inbound and outbound adaptors.
In this article, I'm going to give a quick example of how to connect to an SSH server using the class, describe your options for authenticating, and how to debug when things go wrong.
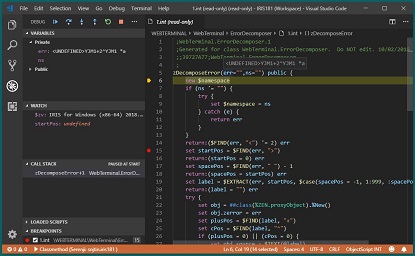
We at George James Software are pleased to announce that our acclaimed code debugger and editorSerenji is now available as a Visual Studio Code extension.
As well as supporting the latest InterSystems IRIS platform Serenji also works with earlier platforms, including versions lacking the server-side Atelier API support required by other VS Code extensions.
Serenji connects you directly to the code in your namespaces, resulting in an experience more familiar to existing Studio users. No need to export and import classes and routines.
We believe Serenji is the first extension to bring VS Code's powerful debugging features to ObjectScript developers.
I'm using Studio to develop. I've been using the built-in debugger and it has been working nicely. But now, since the upgrade, I'm getting this error when trying to debug any routine or class method:
Our development server is set up to automatically keep the .INT code of compiled classes and routines, but the live servers are set to not keep the .INT code.
I know how to set the system to keep this code ($SYSTEM.OBJ.SetQualifiers() ?) but what are the ramifications of keeping this code on the live servers? Is it just a space issue? I always thought it was to keep the code more private.
At the George James Software booth at Global Summit last year we took the wraps off the work we've been doing to make our popular editing and debugging tool Serenji available on the Visual Studio Code platform.
Rather than requiring you to pull code from your namespaces into local files, then push the changes back to the namespace to run it, you work directly in the namespace. In other words, the editing experience is like Studio rather than like Atelier.
As well as editing code you can also debug it directly from VSCode.
I just downloaded and installed the latest WebTerminal into my local copy of Healthshare 2016.2.1
I installed via studio and everything compiled without error.
However when I run it I just see a black screen. The help window at the bottom of the screen pops open when I type '/' but I just can't get any response.
Using our cool new debugging extension for Visual Studio Code I'm trying to debug a CreateProjection method of a class, but when I compile it the work apparently gets done in one of the worker jobs, so my breakpoint never triggers.
Is there a compiler flag or qualifier to force the compilation to be done in-process rather than getting handed off to a worker job?
Not everyone knows that InterSystems Caché has a built-in tool for code profiling called Caché Monitor.
Its main purpose (obviously) is the collection of statistics for programs running in Caché. It can provide statistics by program, as well as detailed Line-by-Line statistics for each program.
Using Caché Monitor
Let’s take a look at a potential use case for Caché Monitor and its key features. So, in order to start the profiler, you need to go to the terminal and switch to the namespace that you want to monitor, then launch the %SYS.MONLBL system routine:
If you are attending Global Summit 2018 please be sure to say hello to George James Software in the Partner Pavilion.
You are also invited to the informal lunchtime meeting we're hosting at Global Summit on Tuesday 2nd October from 1pm in Indian Paintbrush, a meeting room at the conference venue. We will be previewing the next versions of Deltanji, our integrated source code management solution, and Serenji, our editor and debugger.
https://www.youtube.com/embed/xr1Ncz_ZH_Q [This is an embedded link, but you cannot view embedded content directly on the site because you have declined the cookies necessary to access it. To view embedded content, you would need to accept all cookies in your Cookies Settings]
I would like to share with you my experience regarding to debugging via Atelier.
I'm developing a REST API and would like to attach to a process when I call the API via a REST Client tool, for example Postman. The purpose is to inspect values from HEADER and BODY of the HTTP request during the debugging process.
Come on! How am I doing? I am going to demonstrate that by using a class from SAMPLES namespace.
1 - Open Atelier;
2 - Open your REST Service class;
3 - Go to the method related to the URI that you need to debug;
One of the most important features during application development is the ability to debug your code easily. Because of the asynchrnous nature, a standard Node.js application server works single-threaded by default. When you are developing applications using an IDE like Visual Studio Code, you can very easily debug your Node.js process:
I am running a ZBREAK trace on a legacy FDBMS application that uses arrays but rather than displaying the array value contents, I am seeing logs similar to the following.
Trace: ZBREAK SET LINE=Array Val at BIOPWR+6^BIOPWR
I need to get the source code of a class installed on a remote server. I have no Studio or Atelier access to it but I can manage REST and Web terminal access.
Hi I'm hoping the community will once more help me out with a question!
Right I have a production that takes an attachment from an email and processes it, sending out a hl7 message at the end. This works ok.
Now I just need to take the email and send it back out to a 'backup' email address, basically giving a) A backup incase there is a problem with the email or something else further down the line. b) A log of the emails receieved.
So I thought the best thing to do is have an operation with an email adapter and to send that my message.
In this article I'll cover testing and debugging Caché web applications (mainly REST) with external tools. Second part covers Caché tools.
You wrote server-side code and want to test it from a client or already have a web application and it doesn't work. Here comes debugging. In this article I'll go from the easiest to use tools (browser) to the most comprehensive (packet analyzer), but first let's talk a little about most common errors and how they can be resolved.
In case of system exception (missing property, method etc) Cache Studio's debugger stops at the line throwing it. Unless the line is in try/catch block.
Is there a way to make it break also in try/catch case?
Cache Studio almost always crashes when I click rows in Call Stack view during debugging. Then Cache has to be restarted because last edited file remains locked.
Looks like I'm the only one who uses the debugger. Or is there a magic spell to make stack view working?
 By date
.png)
 Open Exchange app