Profiling code using Caché Monitor
Not everyone knows that InterSystems Caché has a built-in tool for code profiling called Caché Monitor.
Its main purpose (obviously) is the collection of statistics for programs running in Caché. It can provide statistics by program, as well as detailed Line-by-Line statistics for each program.
Using Caché Monitor
Let’s take a look at a potential use case for Caché Monitor and its key features. So, in order to start the profiler, you need to go to the terminal and switch to the namespace that you want to monitor, then launch the %SYS.MONLBL system routine:
zn "<namespace>"
do ^%SYS.MONLBL
As the result, you will see the following:
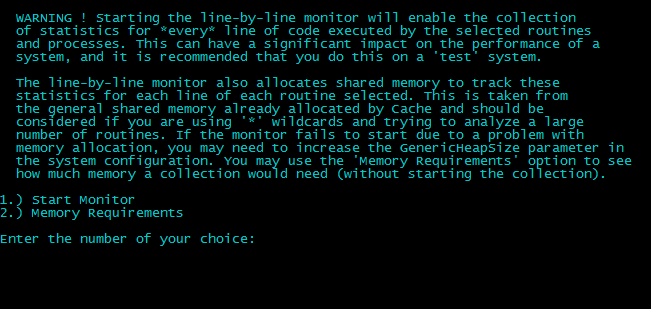
There are just two options here: the first one allows you to actually launch the profiler, the second one – to imitate the launch for assessing the amount of memory needed. Please note that simultaneous monitoring of a large number of programs may require a considerable amount of memory. If you still need it, you may want to increase the value of the gmheap parameter (this can be done in Management Portal => System Administration => Configuration => Additional Settings => Advanced Memory Settings. Caché will have to be restarted after you change this parameter).
Let’s select option one. The program will prompt you for the name of the program to be watched. You can use a mask with a "*" symbol. To view the list of programs that are already being watched, use the following command: "?L".
In this example, I will monitor all the programs in my namespace, so I’ll just type in "*".

An empty line marks the end of input. As you can see, 246 programs have been selected for monitoring.
We will now need to select monitoring metrics. Caché Monitor supports over 50 metrics, including the following ones:
- Number of global references
- Time spent on line execution
- Number of Caché Object Script lines
- Number of executed lines
- The number of executions of a particular line
- The number of blocking commands
- The number of successful blocking commands, etc.
In the majority of cases, the developer will need a minimum of metrics (number of lines, number of executed lines, number of executions of a particular line, time of execution of a particular line). These stats will be collected if you select option 1 (default value). If necessary, you can collect all stats or pick particular metrics only. In my example, I will be using a minimal set of metrics:

On the next step, the system will suggest choosing processes to be monitored. You can collect statistics for particular processes (you’ll need to provide a list of their PID’s), for the current process or for all of the. Again, I will stick with the default option.
Should the start be successful, you will see a “Monitor started” message. Hit Enter to open the monitor menu:
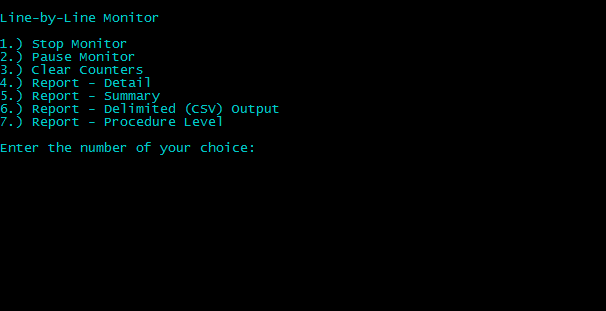
Let’s run through the items. Stop Monitor – full termination of monitoring activities. This will also delete all statistics collected so far. Pause Monitor – suspension of monitoring activities with a possibility to resume them and preserve the collected statistics. Clear Counters – reset statistics.
The following four commands are responsible for the output of collected statistics. The first two are the most popular ones: output of detailed line-by-line information for a particular program and output of combined statistics for all executed programs. When these commands are selected, the system will prompt for a list of programs for which statistics will be shown and the name of the file the information will be saved to (if you do not do this, statistics will be shown right in the terminal). Also, you can always include the source code (if any), in addition to INT code, into the output file, but there will be no detailed statistics for it.
Everything is ready, let’s start the necessary programs and take a look at the statistics.
Attention! Using Caché Monitor may affect the system performance, which is why it’s not recommended to use it in production systems. Please use on development and debugging stages only.
A small bonus
To make the viewing of monitoring results more convenient, I have written a small web application that you can download from our GitHub repository
The application can currently do the following:
- Start, Stop, Pause/Resume Caché Monitor.
- Collect a minimal set of metrics for programs.
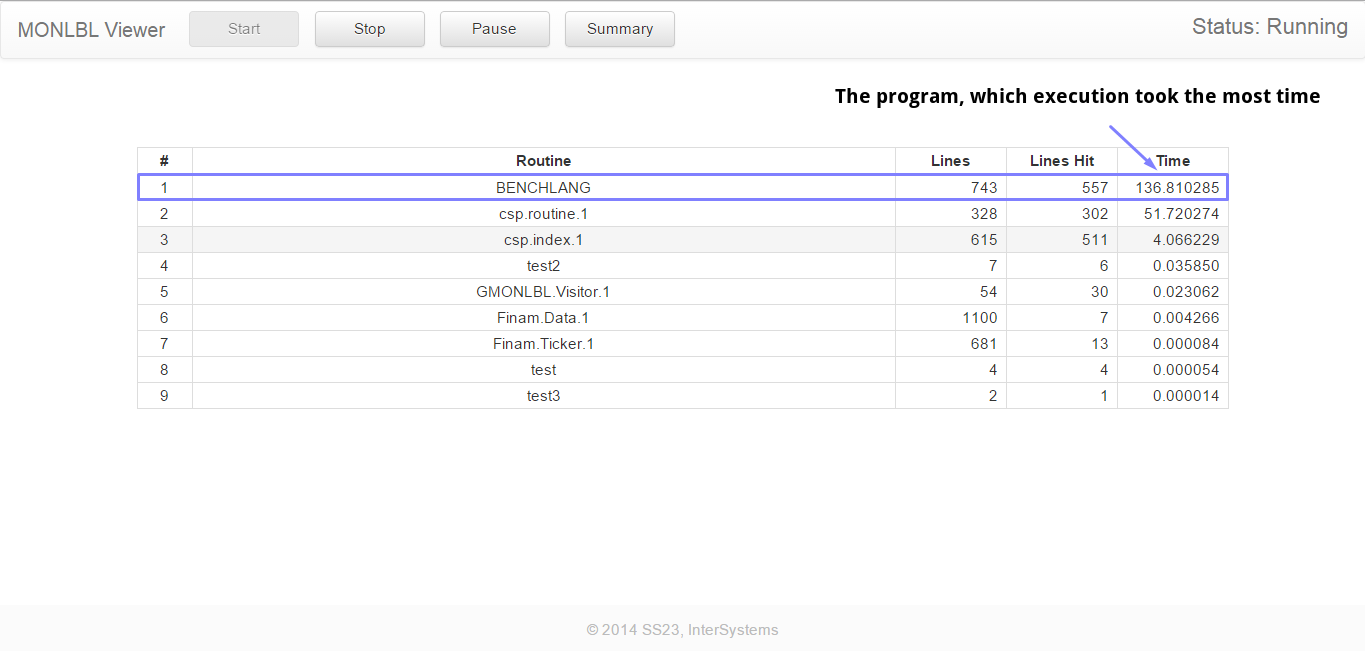
- Show a statistics summary for programs.
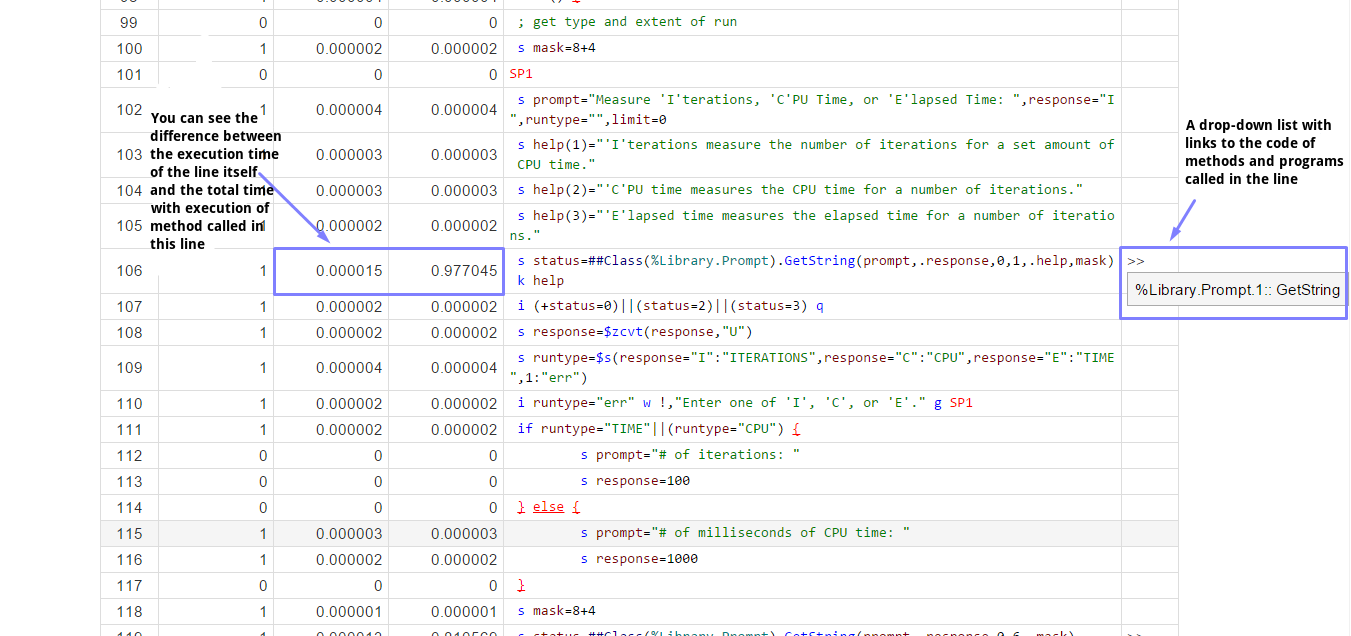
- Show detailed Line-by-Line statistics for a particular program.
- Highlight syntax.
- Jump from a call to a class-method or program (program label) to the code of this class-method of program (if the code is available and is being tracked by the monitor).
- Namespace changing.
A couple of screenshots
Please note that the application is distributed under an MIT license (that is, distributed “as is”), as it uses undocumented functions of Caché and its operation is not guaranteed on different versions due to possible changes of undocumented features from version to version.
This is a translation of a Russian-language article published on the Habrahabr 12/16/2014: Профилируем код с помощью Caché Monitor