Node.js: multi-target debugging QEWDjs using Visual Studio Code
One of the most important features during application development is the ability to debug your code easily. Because of the asynchrnous nature, a standard Node.js application server works single-threaded by default. When you are developing applications using an IDE like Visual Studio Code, you can very easily debug your Node.js process:
First, download the free Visual Studio Code IDE (@code) and install it on your development machine.
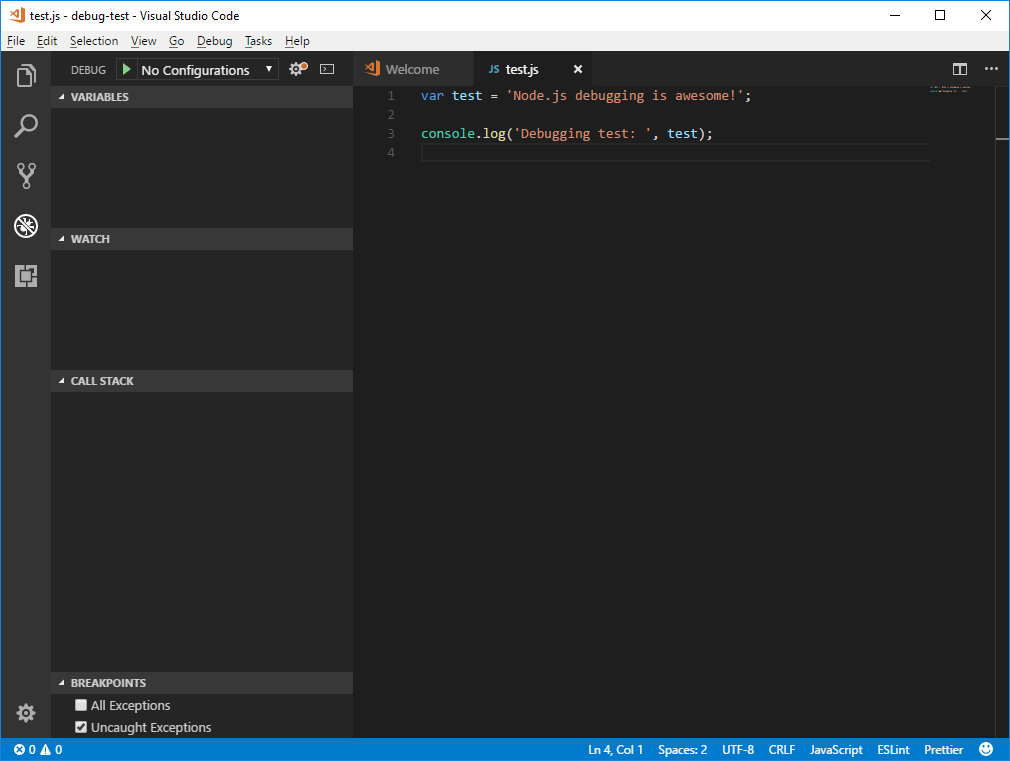
We will start with basic debugging using a very small test.js file and go to the debug view:
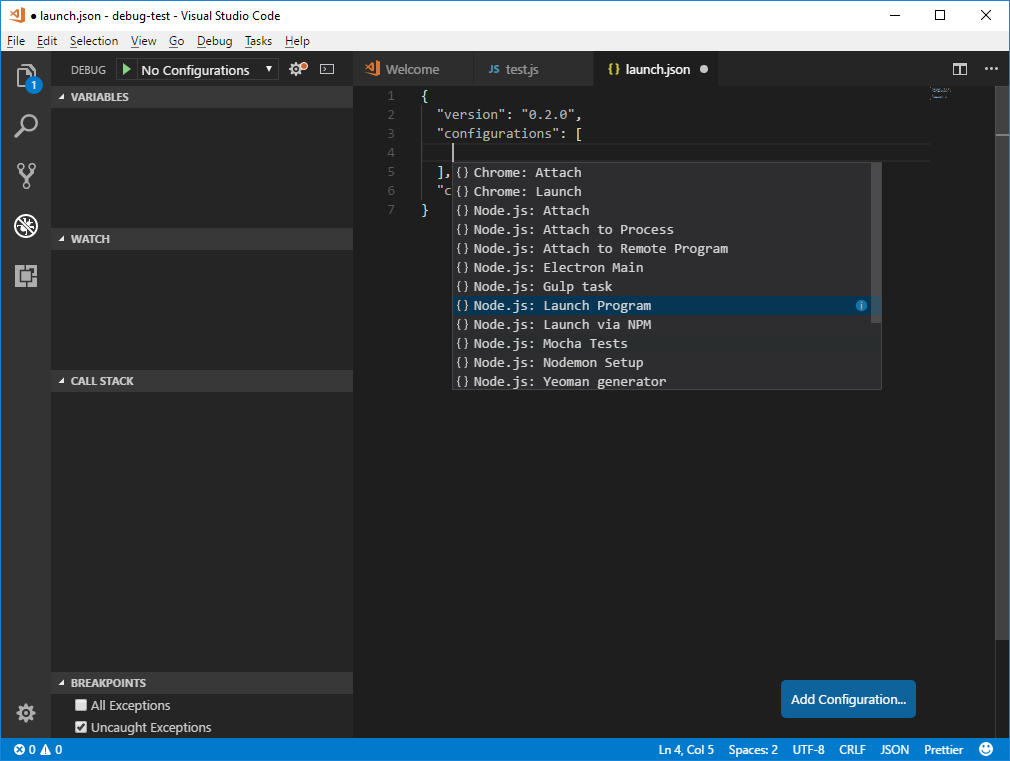
You'll notice we need to define a debug configuration first (at the top, click on "No configurations" and select "Add configuration". You'll see a "launch.json" file is created and select "Node.js: launch program":
Modify the "program" property to the filename you want to launch and debug ("program": "${workspaceFolder}/test.js" in this case) and save launch.json. Now you can start debugging - click in the left column of the first "var" line in our "test.js" file to set a breakpoint, start the debug session with the green "play" button at the top (you'll notice that your "Launch program" configuration was automatically selected in the debugger). The debugger stops at our breakpoint:
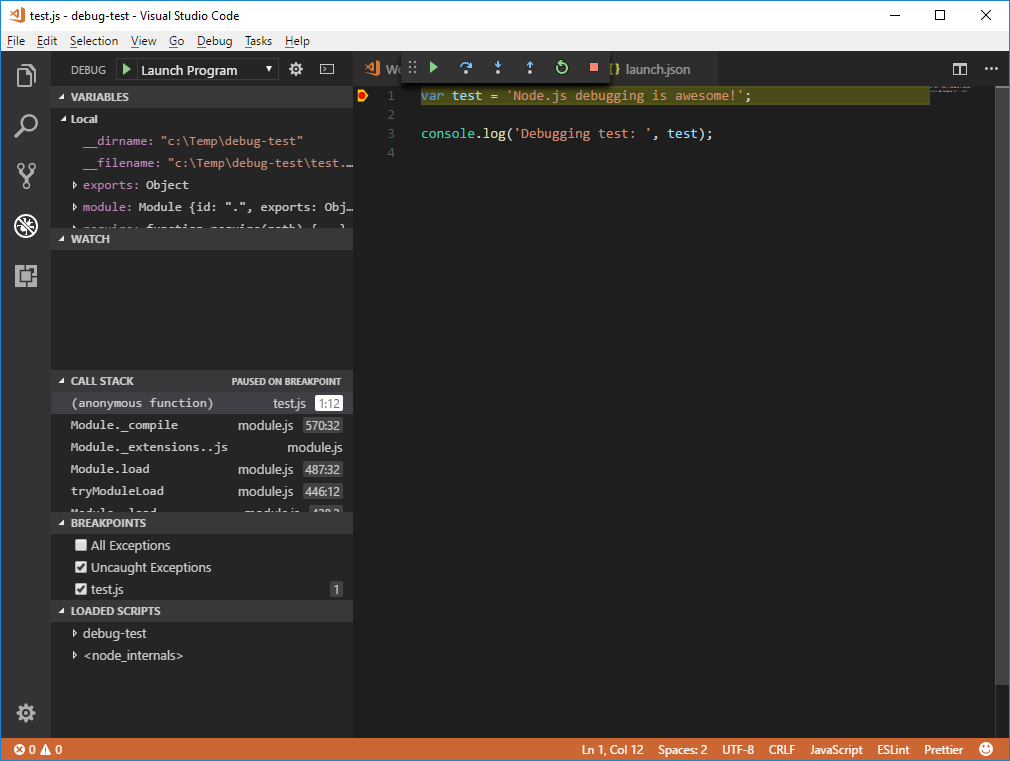
You can step now through the code, view variable contents hovering over the variable names in your code, watch variables, ... (see all possibilities in the Debug menu). You'll see that a debug toolbar is active at the top with the usual debug icons. Also notice on the left in "loaded scripts" that our node.js script is loaded and running.
In this case, we launched the Node.js process "inside" the @code IDE and debug output is available in the "debug output" window:
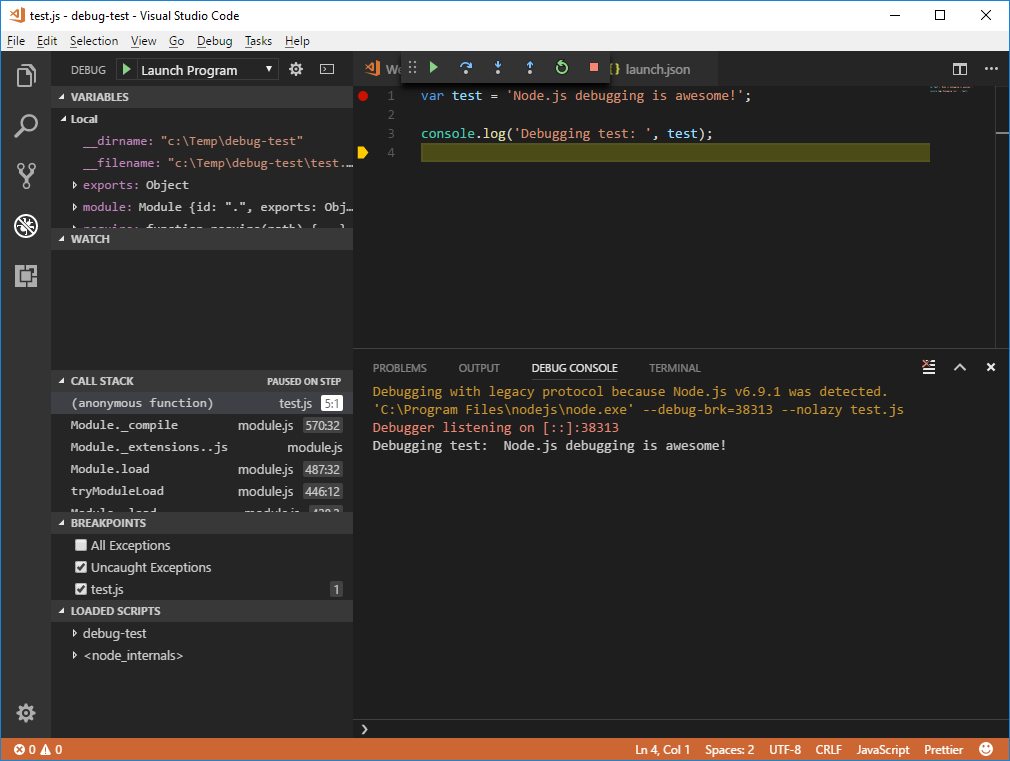
This is the "standard" way of debugging a Node.js application server - @code is by default using the standard "debug" protocol built into Node.js.
You can also debug a Node.js application in a different way: when you run your Node.js application in it's own commandline window, you can "attach" the @code debugger to it. This is the recommended way to debug Node.js applications in a normal (development) setting. To do this, we first add a new "attach" debug configuration:

Go to the debug configuration inside launch.json and modify it as shown here:
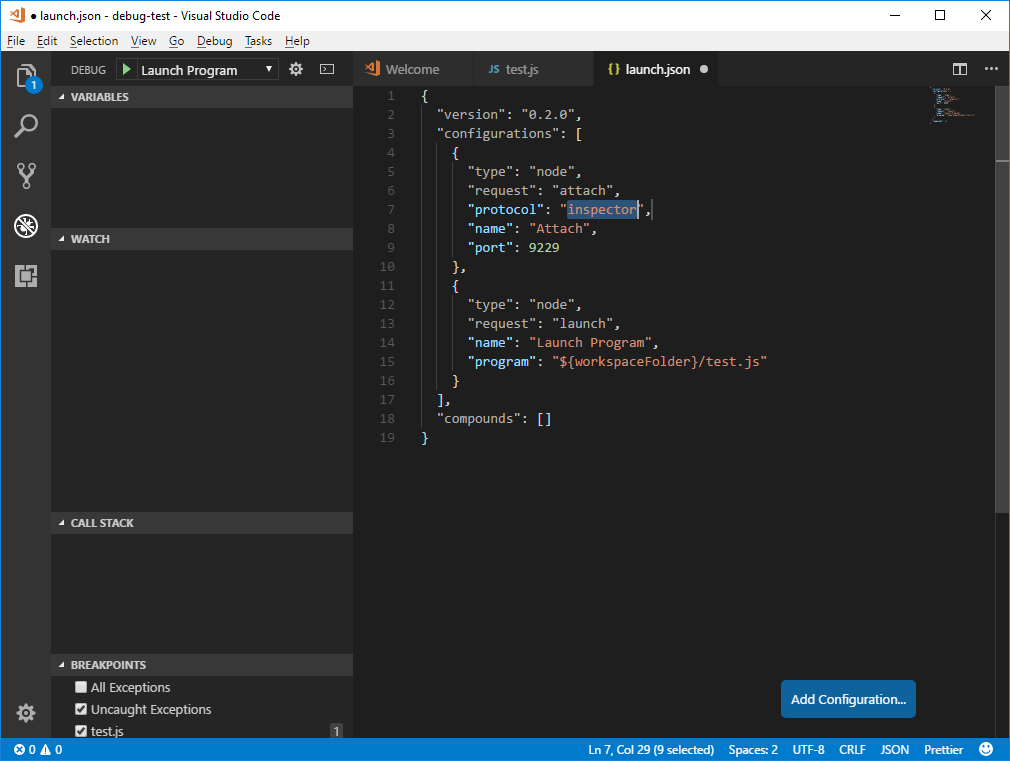
Now launch your Node.js application in it's own commandline window and add both the "inspect" and "debug-brk" flag to debug it ("inspect" is the newest debug protocol in Node.js, please make sure you have at least Node.js version 6.9.x or higher installed for this):
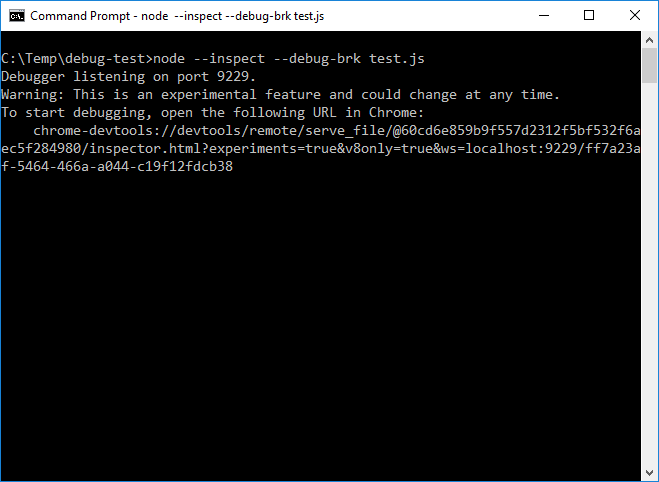
You see your application is started and the debugger is listening on the default inspector port 9229. Because we used the "debug-brk" flag, execution stopped at your first code line and node is waiting for an external debugger (@code in our case) to connect to it. Now go to @code and select the "Attach" debug configuration (don't forget to save "launch.json" first!), now set only a breakpoint on line 3 and start debugging:
 You see the code is stopped at the first line (because we used the "debug-brk" flag) and we can debug again as usual. Output is appearing in our commandline window now. You see the debugger is attached too.
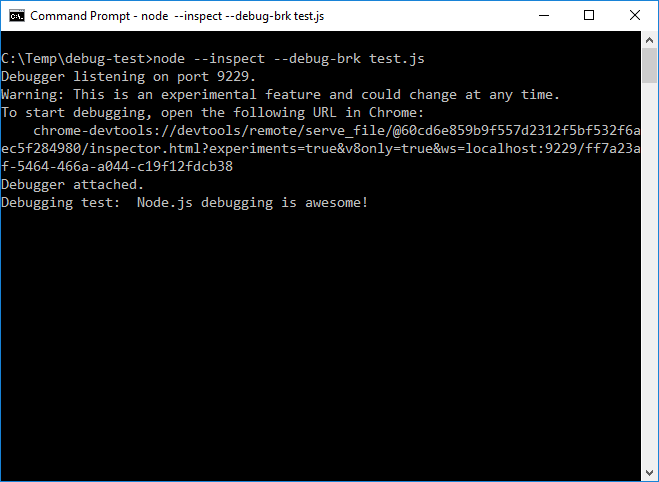
When finished, disconnect the @code debugger with the rightmost icon in the debug toolbar. The node.js process in your commandline window will stop as soon as the @code debugger has disconnected.
Above you could see how to debug a Node.js application running in a single thread. However, to take advantage of multi-core CPU's, Node.js also allows you to fork multiple child processes in your application using it's Child process module. In your code, you'll typically use the fork() method to start additional child processes. When you want to debug these, you'll need to launch them each with a different "inspector" port, because the Node.js child process module doesn't detect automatically the master process was started in debugging mode and you need to "fix" the commandline arguments for the child processes you are forking. A good way to do this is to increment the standard inspect port when forking each child process like the code in the ewd-qoper8 module does for you inside the QEWDjs application server framework:
var q.worker.debugPort = 5858;
...
var cp = require('child_process');
...
var execArgv = process.execArgv.map(function (option, index) {
if (option.indexOf('--inspect') !== -1) {
q.worker.inspectPort++;;
return '--inspect=' + q.worker.inspectPort;
}
else if ((option.indexOf('--debug') !== -1) && (option.indexOf('--debug-brk') === -1)) {
q.worker.debugPort++;
return '--debug=' + q.worker.debugPort;
}
else {
return option;
}
});
var workerProcess = cp.fork(this.worker.loaderFilePath, args, { execArgv: execArgv, env: process.env });
As each child process has it's own debug port, you'll no longer get "Unable to open devtools socket: address already in use" errors when forking child processes with debugging options.
FYI, if you use the Node.js cluster module in your applications, each forked worker will get it's inspectPort incremented automatically. The cluster module fixes this for you.
Because you want to debug these more complex situations where your Node.js application server is running a master process and multiple child/worker processes, we will use the technique above to run each process on it's own inspect port. We can now easily define a multi-target debugging configuration and debug seamlessly as you do with a single-threaded server instance.
I will show here how this works with a QEWDjs back-end server as I used in my React example part 2. In this example, the QEWDjs server has a poolSize of 1, this means you have a single master process and one worker process. The worker processes are started on-demand by default, but QEWDjs allows you to prefork them by adding a "poolPrefork: true" parameter in your QEWD config. This is necessary to make sure all worker processes are running before we start debugging in @code.
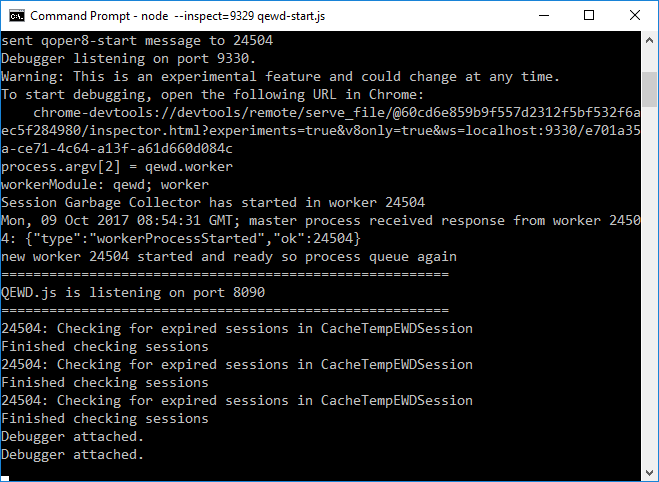
In this debug setting, you will launch your QEWD server in debug mode using inspect mode with an optional starting port:
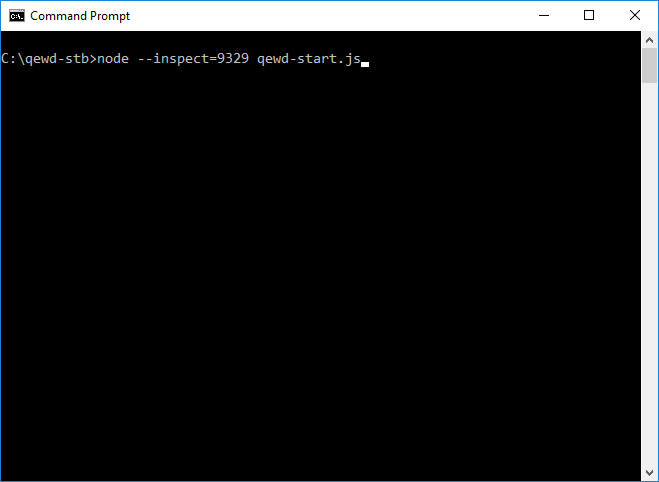
This means your master process will listen on port 9329 and your first worker on port 9330, additional workers will listen on 9331, ...
In @code, we will now define all debug configurations needed to attach to both Node.js processes. Attaching to the QEWDjs server is the way to go here because when you are using the microservices capabilities, you can have multiple QEWD server instances running on your development environment and sending the output to one single debug console in @code could become very confusing as you don't know which instance output is coming from.
Go to @code and add two configurations as shown below:
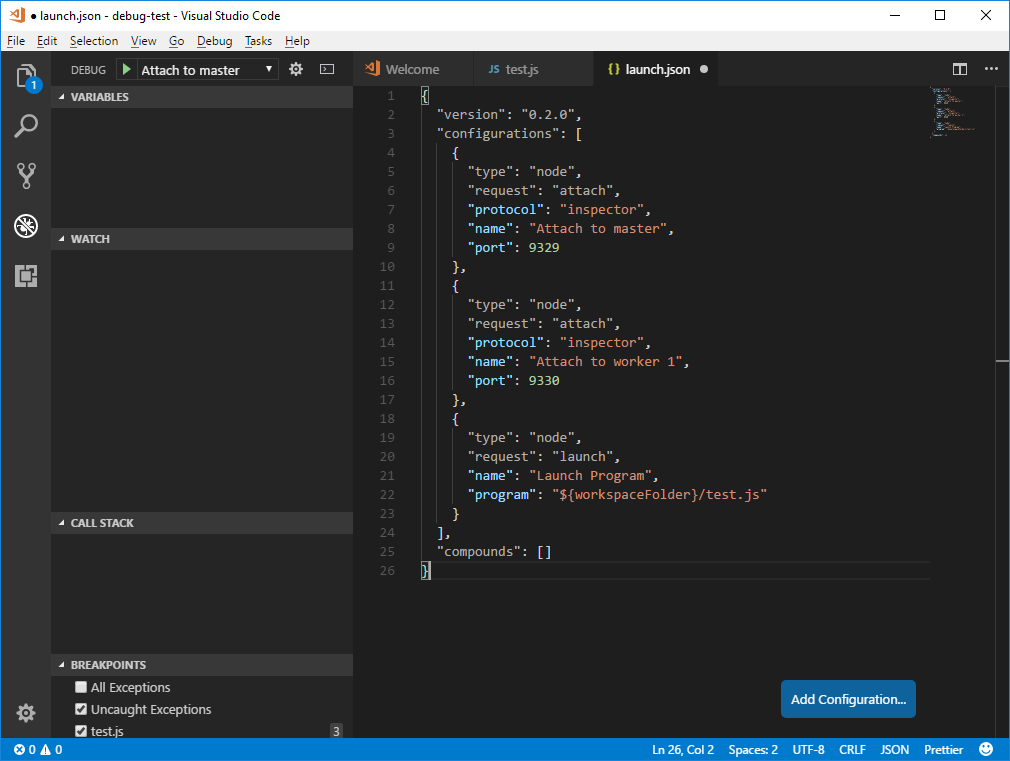
We added an "attach" debug configuration for the master process and one for the worker process (on different ports).
Now we can just use the "compounds" feature in @code to tie together both debug configs to one compound debug config we can start at the same time:

Now start debugging by selecting the "multi-target debugging" config at the top and watch the debugger attaching to both Node.js processes:
You see "Debugger attached" appearing twice now. You can now easily debug in @code the same way as you would debug a single-threaded instance of Node.js - you won't see any difference. Just add your breakpoints, single-step through the code, ...
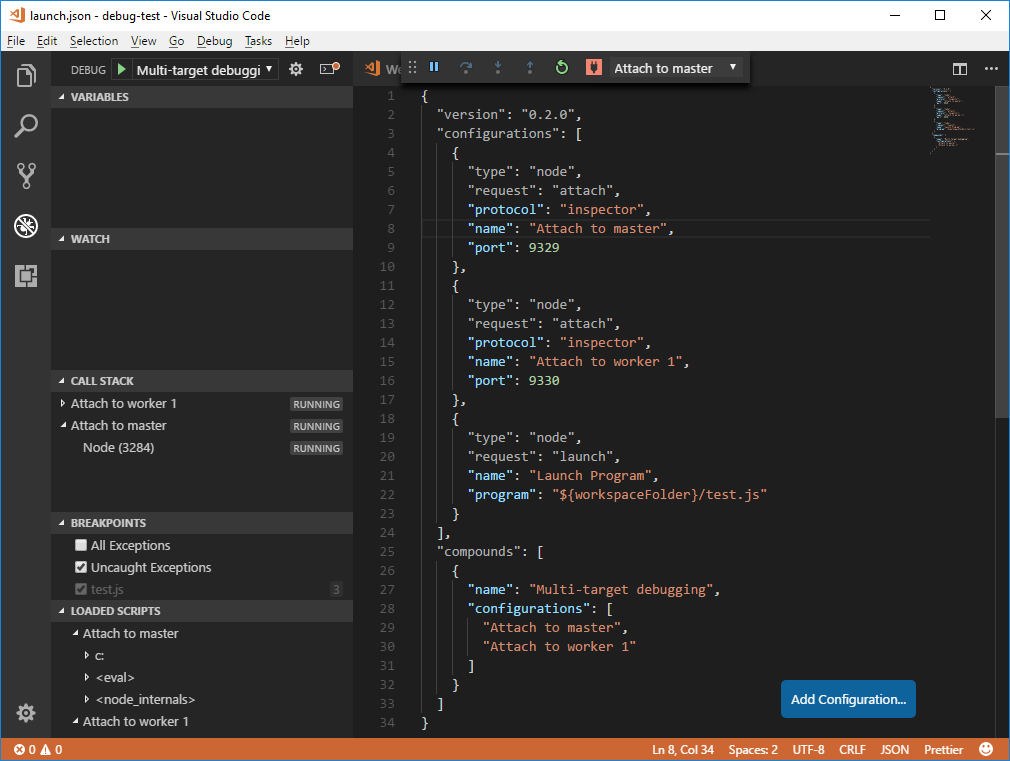
You'll notice a difference at the left side: you see multiple processes running now on the call stack and in loaded scripts.
To stop debugging, you'll need to disconnect all debug connections (you'll have to click "disconnect" in the top toolbar as many times as you have Node.js processes).
This feature in @code makes it very powerful and as I outlined above, you can easily extend this to multiple server instances and more workers: just start the first one on the default debug port with:
and the second instance with:
Just add more debug configurations and compounds accordingly and you can debug as many processes simultaneously as you like!
QEWDjs takes care of assigning debug ports correctly to each worker started.
If you combine the debugging functionality for your Node.js JavaScript code with the Serenji debugger and/or Studio/Atelier, you can debug your extrinsic functions you can call from JavaScript with the qewd-cos module too in Caché (adding the power of classes and SQL to JavaScript!).
Happy debugging! ![]()