Debugging is the process of finding and resolving defects or problems within a computer program that prevents the correct operation of computer software or a system.
We are calling a REST web-service from Ensemble using EnsLib.HTTP.OutboundAdapter and redefining the adapter class to set custom headers as described by @Eduard Lebedyuk here: How to set Content-Type
I have an operation using $ZF this operation ran and did not error but the job has been active and it can not be stopped I have tried stopping it from the front end and through the terminal using ##class(ENSLIB.Job).%New() Stop method. Now my production will not update even if I add a new item to the production I cannot update the item is there a way to force stop this job.
We are using a DTL transformation to take HL7 and transform into custom XML (XML is a virtual document, held in an EnsLib.EDI.XML.Document object). The schema specifying the format of the XML says one element should occur no more than 24 times (maxOccurs="24" in the XSD schema). However, the transformation to produce one such element always produces 24 elements, all but the last one blank, when tested stand-alone.
We are using a DTL transformation to take HL7 and transform into custom XML. But the nodes in the resulting XML are appearing out of sequence - and therefore failing validation against the schema.
The XSD schema for the XML looks fine when imported into Ensemble: root node in the XSD looks like this: And shows in Ensemble like this:
I need to see the full SMTP trace when a %Net.SMTP attempts to send an email to troubleshoot an issue. As far as I know, the only way to get that is to uncomment line 192 in the %Net.SMTP class.
//:#define SMTPTRACE
I've done this in the past by giving myself the %DB_IRISSYS role, so I tried that. That database is also not mounted as read-only.
Developers have Ensemble installed locally on their laptops - code will be developed locally then deployed to integration, test/UAT and ultimately production servers in due course.
One of the other applications we are developing around happens to utilise an Iris desktop client to a remote Iris server. We want to have the application available on the developers laptops alongside the local Ensemble instance.
Is there a general way to set a variable XYZ equal to the text of thecode line being executed now? Debugger or production. For example, for a code below if code is currently assigning a to 1, XYZ would be equal "S a=1". The same question about a variable containing current routine name.
If anyone has experience debugging Embedded Python or has insight into why an ObjectScript method when called from a Python method would not work but would work when called directly via ObjectScript or in a Python shell, your help would be appreciated!
We have an ObjectScript ClassMethod called GetTemplateString() which takes in a templateName of String type and uses the template name to get the template object, access the Code, and read the code into a templateString. The string version of the Code is returned.
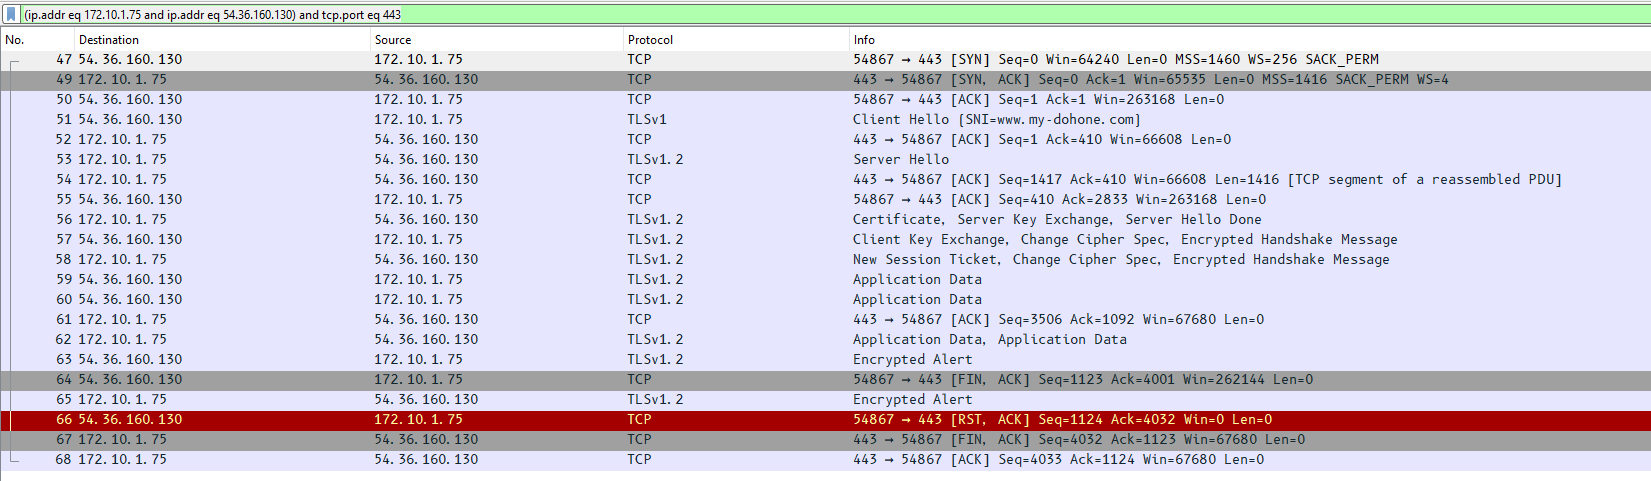
I need to check my HTTPS POST REQUEST, in order to do this I try to catch it by using wireshark.
I can't see anything because of the encryption.
I try unsuccefully to use the SSLKEYLOGFILE key (windows 11), but the generated file did not increase when I trigger my code OR postman, it grows only by the action of the web browser.
We have a custom business service that is triggered by a scheduled task. The service queries a table, iterates over the result set and sends a message on to a business process for each result. Happy path functionality is all fine.
However, when there is an error detected in the business service code, neither throwing an exception nor returning an error %Status behaves as we'd expect.
Two of the HC servers I manage (a mirrored pair) have lost the ability to debug code, and I am unsure as to why this has happened. Clearly something has changed, as the other three are working just fine.
When I select a Class Method as debug target, add a few break points and run it, I get the following Output
I'm facing an issue while converting an ORU_R01 HL7 message to XML, specifically with the <pidgrpgrp> kind elements. When I use the getvalueat() method before conversion, the XML includes the <pidgrpgrp> and other <grp> elements, but when I don't use the getvalueat() method, the XML is generated without these <grp>elements.
We have several clients in different productions all accessing a web-service. We are trying to add another client in a new production, and its not working. The messages between the relevant Process and the SOAP web-client Operation are the same in the working and the non-working productions. But the web-service is reporting an XML parsing error to the non-working production. Here's the error as reported in the SOAP web-client Operation...
I am currently debugging a piece of code relying heavily on macros. I am using breaks in the method to then check the values of macros and object properties as I go. However, any time I invoke a macro within a break I get an error. To get around this I am converting the macro calls into the underlying code. Some of these macros have messy translations and this is somewhat time consuming. Is there an easier way to access macros from within a break?
I'm at a loss with configuring the IRIS ODBC driver (v02.10) on my Amazon Linux machine, connecting to a REMOTE IRIS backend. It should be simplified by not requiring a DSN (the app uses a DSN-less connection and generates the connection string). I have
I have created a Business Operation (BO) named "Sender" that sends HTTP messages to an endpoint (for testing, I'm using Postman's Mock Servers).
Goal: I want to set up an automatic timeout mechanism so that if I don't receive a response from the server within 18 seconds, an alert is generated and the message is resent. This process should be repeated every 18 seconds, for a maximum of 90 seconds. If no response is received within 90 seconds, I would like to generate an error message. On the other hand, if a response is received, I want to stop the resending process and complete the operation by indicating successful reception.
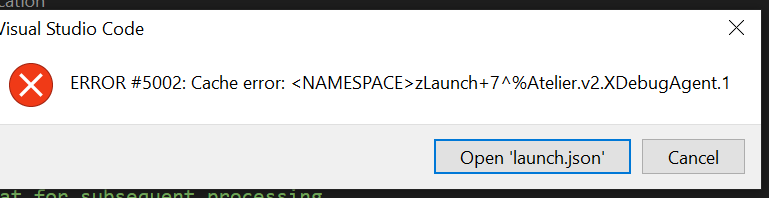
Hi I am trying to run a debugger in VS Code. I have the settings.json file and the launch.json file. I am trying to debug code using the attach to a process method, however when I run the debugger I get the following error.
Launch.json code
{
// Use IntelliSense to learn about possible attributes.
// Hover to view descriptions of existing attributes.
One of our development Ensemble instances is misbehaving. We suspect we'll just need to reinstall it - which would be a hassle. Before we do, we wanted to check we weren't missing some kind of easy fix. The symptoms we are seeing:
 By date
.png)
.png)
.png)