A Dive into Debugging Embedded Python
1. A Motivating Example
Embedded Python has been around for a while. You probably followed the tutorials and learned about it. However, if you've tried to combine Python and ObjectScript in real development work, you probably ran into situations where you get an error message like this:
USER>Do ##class(MyClass).SomeMethod()

ERROR #5002: ObjectScript error: <PYTHON EXCEPTION> *<class 'ZeroDivisionError'>: division by zero
It's a long string for limited information. All we know from this message is that a Python error occurred where (a) the error type is ZeroDivisionError; and (b) the error message is "division by zero".
Now, is this sufficient information for us developers?
Well, an experienced developer will search for all occurrences of the division operation in their Python code. If there is a limited amount of Python in the codebase or if there are limited division operations involved, it's definitely debuggable. But, what if we're dealing with a codebase with a lot of Python and we're not sufficiently familiar with the codebase and cannot narrow down the search based on the error type and error message? That would be a nightmare!
In this article, we'll dive into how to debug errors buried deep in the call stack of embedded Python.
2. Some Ways That Don't Work
You may be tempted to try a number of debugging techniques. But before we start hacking, here are some ways that are known not to work.
2.1 Utilizing Python's sys.excepthook
If you're familiar with Python, you may know that Python calls sys.excepthook() on every unhandled error (meaning not caught by a try block). The default behavior is to print the error's stack trace in a human-readable format. Can we set sys.excepthook to a custom hook function that logs the error?
Disappointingly, sys.excepthook() never runs. It might sound weird, but it's actually the intended behavior. The rationale is that each error should only be handled once. If it's handled at the Python-level sys.excepthook, then there is really nothing left for ObjectScript to handle! Since we made an ObjectScript call – Do ##class(MyClass).SomeMethod(), it makes sense that the error is wrapped as an ObjectScript error for us to handle. This is also why if you get an error in the interactive Python shell do $system.Python.Shell(), the error is handled at the Python level by sys.excepthook.
2.2 Accessing %objlasterror
You may also be tempted to Zwrite %objlasterror and hope there's useful information encoded in that complicated long string. Unfortunately, you'll see that the string only contains the ObjectScript call stack, but not the Python one. The only information relevant to the Python error is the error's type and the error message. This is the same as the 5002 error message we're already seeing.
2.3 Accessing %Exception.PythonException:ExceptionObject
Another idea is to capture the Python exception instance in ObjectScript and then examine the details (mainly the traceback) of the Python error there.
Try {
  Do ##class(MyClass).SomeError()
} Catch ex {
  ...
}
If you Zwrite ex, you'll see that it has type %Exception.PythonException and has a property ExceptionObject that is a %SYS.Python object! If this is the Python exception instance, then our problem is solved. However, this ExceptionObject is actually the class of the exception rather than the exception instance itself. In other words, it returns the class ZeroDivisionError rather than an instance of ZeroDivisionError.
There is a huge difference between the exception class and the exception instance. With the exception instance, we can access the exception class (via instance."__class__") and the call stack trace (via instance."__traceback__") at the ObjectScript level. However, with the exception class, usually the only information is the category of error. Again, this is already printed in the #5002 error message above so %Exception.PythonException:ExceptionObject doesn't offer much information.
There are internal discussions to include the Python exception instance in lieu of or in addition to the exception class for %Exception.PythonException. If implemented, debugging will be much easier, and I'll update this article ASAP.
3. Three Approaches Of Debugging
In this article, we discuss 3 approaches to debugging embedded Python. These are applicable to debugging any other language.
- Examine the error message and call stack traceback leading to the unhandled exception.
- Add a breakpoint where we stop program execution and interactively examine the program state and step through the code.
- After an error occurs, store the failed program state and perform a postmortem analysis. This is a combination of the previous two.
Because of the problem with %Exception.PythonException:ExceptionObject discussed in the previous section, approaches 1 and 3 must happen at the Python level. As soon as we leave the Python realm, we lose access to the traceback immediately.
If the exception instance discussed in the previous section is preserved, things would be completely different – we'd be able to examine the error message at the ObjectScript level and perform postmortem analysis at the ObjectScript level.
3.1 Print the callback
So here's how it works. We wrap the Python method of interest (let's call it ##class(User.MyClass).SomeError()) with a Python try block. Note again that SomeError() must be a [Language=python] method. When the error occurs somewhere in the call stack, catch the error and perform some magic.
ClassMethod SomeError() [ Language = python ]
{
    // some code that may call into other functions and result in errors
}

ClassMethod Wrapper() [ Language = python ]
{
    import iris
    from my_magic import print_iris_exc

    try:
        return iris.cls("User.MyClass").SomeError()
    except:
        print_iris_exc()
}
I don't want to go into the details of my_magic.print_iris_exc(), so I've attached the content of my_magic here for those interested. The idea is that when an error occurs on a Python thread, an exception instance will be registered to the thread's state. The exception can be accessed with sys.exc_info(), which is a 3-tuple containing the exception class, the exception instance, and the traceback object, respectively. The traceback is (the head node of) a linked list, containing a reference to each call stack frame and their associated code object. The print_iris_exc function essentially iterates through the linked list and gathers frame/code information for printing. Voilà,
USER>do ##class(User.MyClass).Wrapper()
Embedded Python Traceback (most recent call last):
  ObjectScript Class "User.MyClass", Method "Wrapper", Line 5
    return iris.cls("User.MyClass").SomeError()
  ObjectScript Class "User.MyClass", Method "SomeError", Line 3
    return iris.cls("User.MyClass").DividedByZero()
  ObjectScript Class "User.MyClass", Method "DividedByZero", Line 3
    return x / y
ZeroDivisionError: division by zero

ERROR #5002: ObjectScript error: <PYTHON EXCEPTION> *<class 'ZeroDivisionError'>: division by zero
3.2 Set a breakpoint for interactive debugging
If we have an idea of where things are most likely to go wrong, we can use pdb, the Python debugger, to set a breakpoint in the code and interactively examine the variable states of each stack frame and step through execution. This can be done either by adding a breakpoint() call in the Python file or by manually running import pdb; pdb.set_trace(). This is functionally equivalent to ObjectScript's Break statement without arguments.
ClassMethod DividedByZero() [ Language = python ]
{
    x = 1
    y = 0
    breakpoint()  # or, equivalently, import pdb and call pdb.set_trace()
    return x / y
}
The code execution will be interrupted at the breakpoint, and a pdb UI will be prompted, where you can choose to step through the code, evaluate expressions, inspect variables, modify the variables, or even jump to another line.
There is a known incompatibility between pdb and embedded Python. For example, pdb cannot retrieve the source code of [ Language = python ] methods. This is because IRIS stores embedded Python code in the ^oddDEF global. This can be fixed by subclassing pdb.PDB and overwriting corresponding methods. Refer to the code here for how to access the embedded Python source code.
Additionally, with the upcoming Python 3.14 release next year, there will be an option to pass a pre-coded list of commands to the breakpoint. This saves a lot of repetitive work (such as importing the iris module) involved in setting up a debugging environment. For example, when Python 3.14 is released and configured for use with IRIS, Python breakpoints can be added like this:
breakpoint(commands=[
    'exec("import iris")',
    'p iris.gref(MyGlobal)[None]',
])
3.3 Postmortem Analysis
Catching the error and printing the callback doesn't require knowledge of where the error happens – it could be anywhere in the call stack. The disadvantage is that we have to pre-define a series of logic for printing the error information.
Setting a breakpoint allows us to dynamically inspect the error and make any ad-hoc debugging steps. However, it requires a decent estimate of where things could go wrong because the breakpoint() needs to be hardcoded before the code is executed.
The approach we're going to discuss in this section, postmortem analysis, combines the advantages of the previous two. You don't need to have an idea of where the error occurs and can dynamically decide what variables or stack frames to inspect if and when an error occurs.
ClassMethod PostMortem() [ Language = python ]
{
    import iris
    import pdb

    try:
        return iris.cls("User.MyClass").SomeError()
    except:
        pdb.post_mortem()
}
The code proceeds as normal if no error occurs. Otherwise, an interactive pdb session will be launched for postmortem debugging
USER>do ##class(User.MyClass).PostMortem()
> /opt/EmbPy/mgr/user/MyClass(27)DividedByZero()
(Pdb) where
  /opt/EmbPy/mgr/user/MyClass(7)PostMortem()
  /opt/EmbPy/mgr/user/MyClass(21)SomeError()
> /opt/EmbPy/mgr/user/MyClass(27)DividedByZero()
(Pdb) p locals().keys()
dict_keys(['x', 'y'])
(Pdb) whatis x
<class 'int'>
(Pdb) whatis y
<class 'int'>
(Pdb) pp x, y
(1, 0)
4. Random Thoughts On The Future
The difficulty in debugging embedded Python lies in the loss of information when passing errors across the ObjectScript-Python boundary. Here's an illustration of how an error is returned in a call stack of mixed Python frames and ObjectScript frames. Here, we start execution from the bottom COS frame and encounter an error in the Python frame. The exception is then propagated back from top to bottom. When passing the exception between ObjectScript and Python, some information is retained, while the rest is lost.

- When an ObjectScript frame calls into a Python frame, where a Python error is raised, it is wrapped as a
%Exception.PythonException, and the Python traceback is lost as discussed in Section 2.3. - When a Python frame calls into an ObjectScript frame, where an ObjectScript error is thrown, it is wrapped as a Python
RuntimeError, and the ObjectScript traceback is also lost.
If we can attach the original Python exception instance in the %Exception.PythonException at the ObjectScript level, and do the same for the other way around, the whole stack trace information can be retained.
Namely,
Class %Exception.PythonException Extends %Exception.AbstractException [ Final ]
{

/// This contains the Python exception object
Property PyExc AS %SYS.Python;

// other properties and methods ...

}
and
// This may need to be defined as a PyTypeObject at C level and preloaded
class IRISException(Exception):
    def __init__(self, msg, irisexc):
        super().__init__(msg)
        self.irisexc = irisexc // the iris exception object
If such a feature is implemented, we can access the unified call stack by recursively inspecting %Exception.PythonException:PyExc and IRISException:irisexc, both of which contain segments of the traceback information. Additionally, we can also perform pdb postmortem analysis by accessing the deepest level of the call stack using syntax like e.PyExc.irisexc.PyExc.irisexc.PyExc."__traceback__".
Comments
really great post!
thanks!
What a terrific article! Thanks.
I hope will see the object %Exception.PythonException:PyExc in the next release of InterSystems IRIS. It will make debugging embedded Python so much easier.
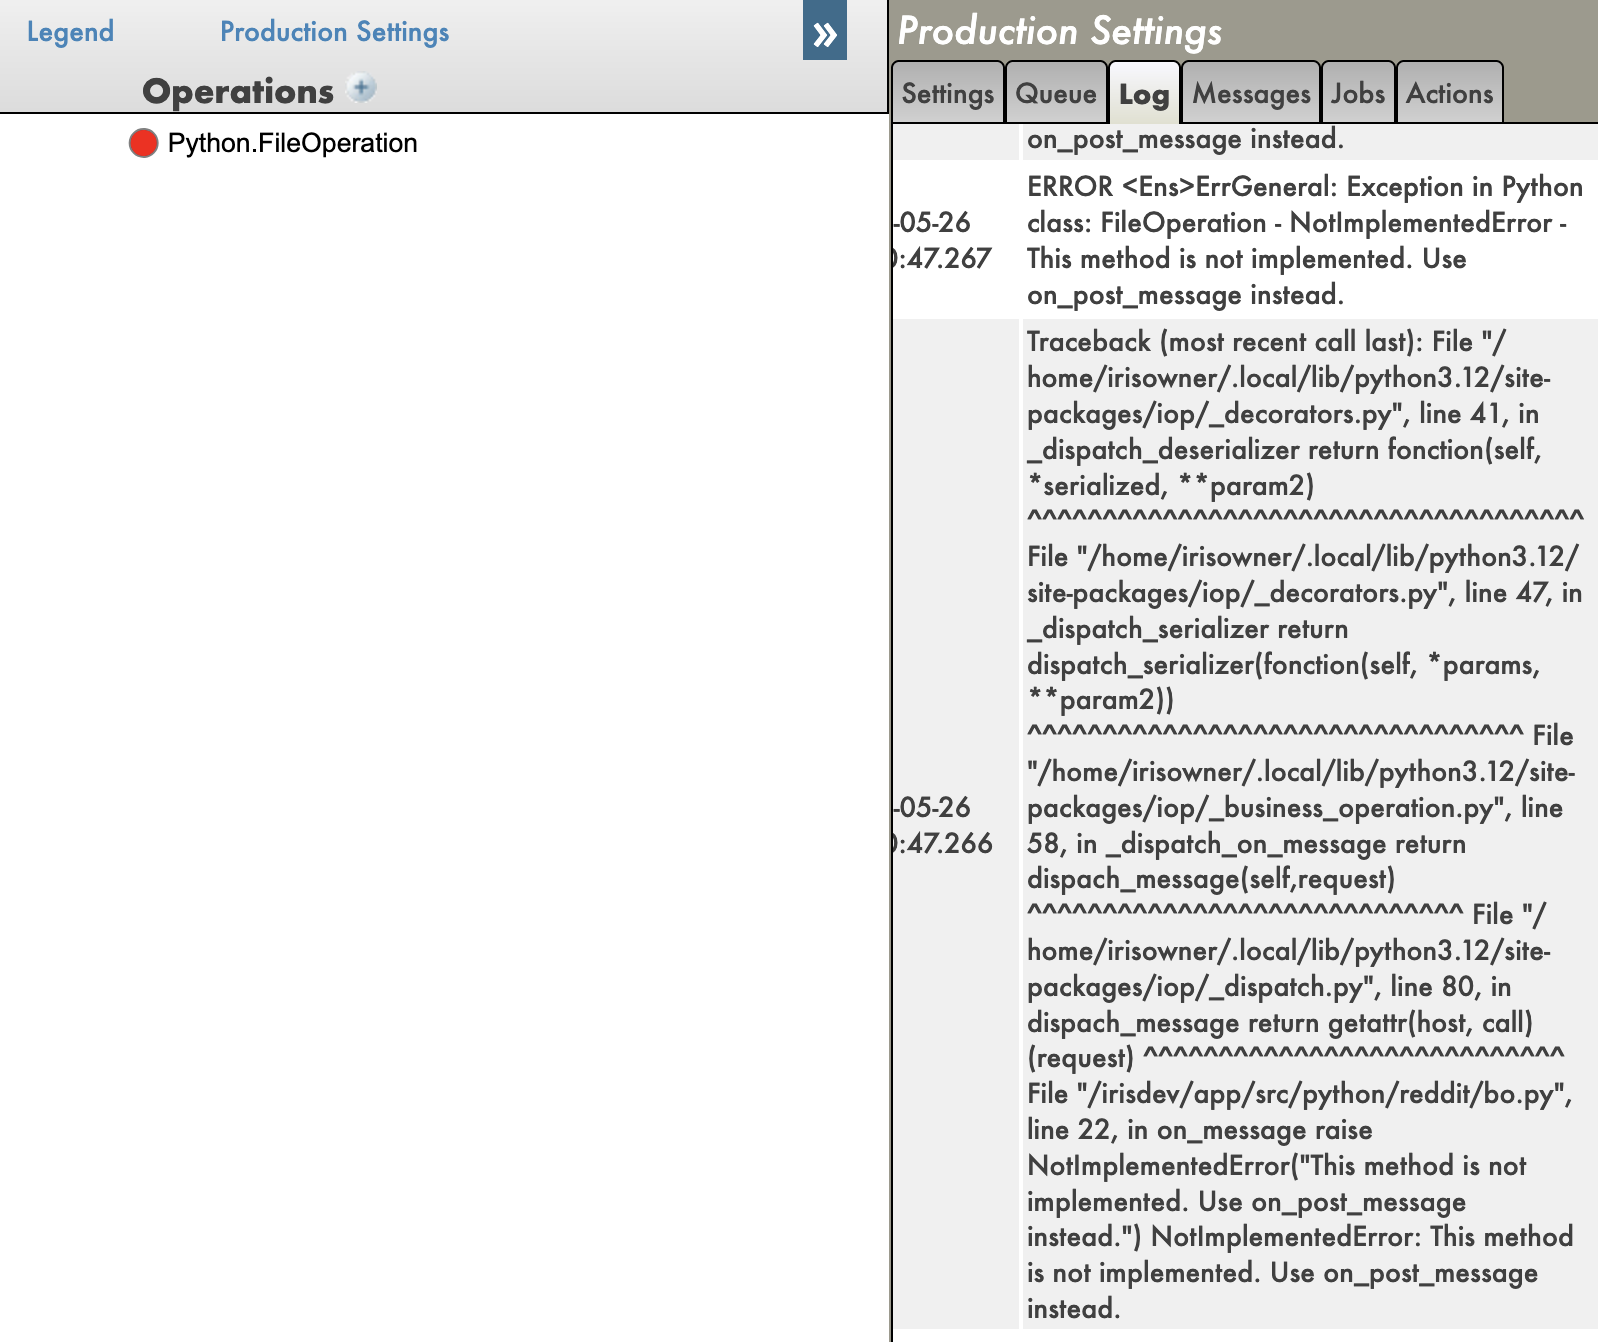
Meanwhile, I implemented a workaround in IoP, it now supports tracebacks and remote debugging. You can find it here:
And tracebacks here:
This is super helpful and insightful, and I'm glad I had a chance to read!
I never tried postmortem analysis but it seems super useful