I am wondering if anyone has created a custom dashboard that can be accessed outside of the Ensemble environment. What I am looking to do is create a dashboard accessible from a person's computer, on the same company network as Ensemble, that can display information regarding specific services, operations, processes, queues, etc. I don't want to give a user access to Ensemble, just allow them to display a page in their browser to give them the information they need to make sure their processes are running.
The situation is, I have a Partner that is looking to create common Dashboards in a SaaS model where the Partner's Clients would want to have their individual views of this common dashbaord be branded (logos, color, styles, etc.) to match the Client's branding. This my Partner's Client's End Users will see this common dashboard as the dashboard from the "Client" and not the "Partner" (and certainly not ISC branding)
I want to know how I can see all of the export options when the widjet is located in the below part of the window. This example is the deepsee web demo, but it's passing in my real application and I can´t move to another place.
I have recently studied deepsee and developed few dashboards needed for our web app users. I am trying to embed them in our existing web app which uses angular with delegated user access. I need to embed the native IRIS dashboard into it. ( I can't use Highcharts or any other js tools).
How do I setup the dashboards to work with delegated authentication (Without providing access to management portal or other parts) ? Also should I use the default csp/{Namespace}/_DeepSee.UserPortal.DashboardViewer.zen? or any other web application URL ?
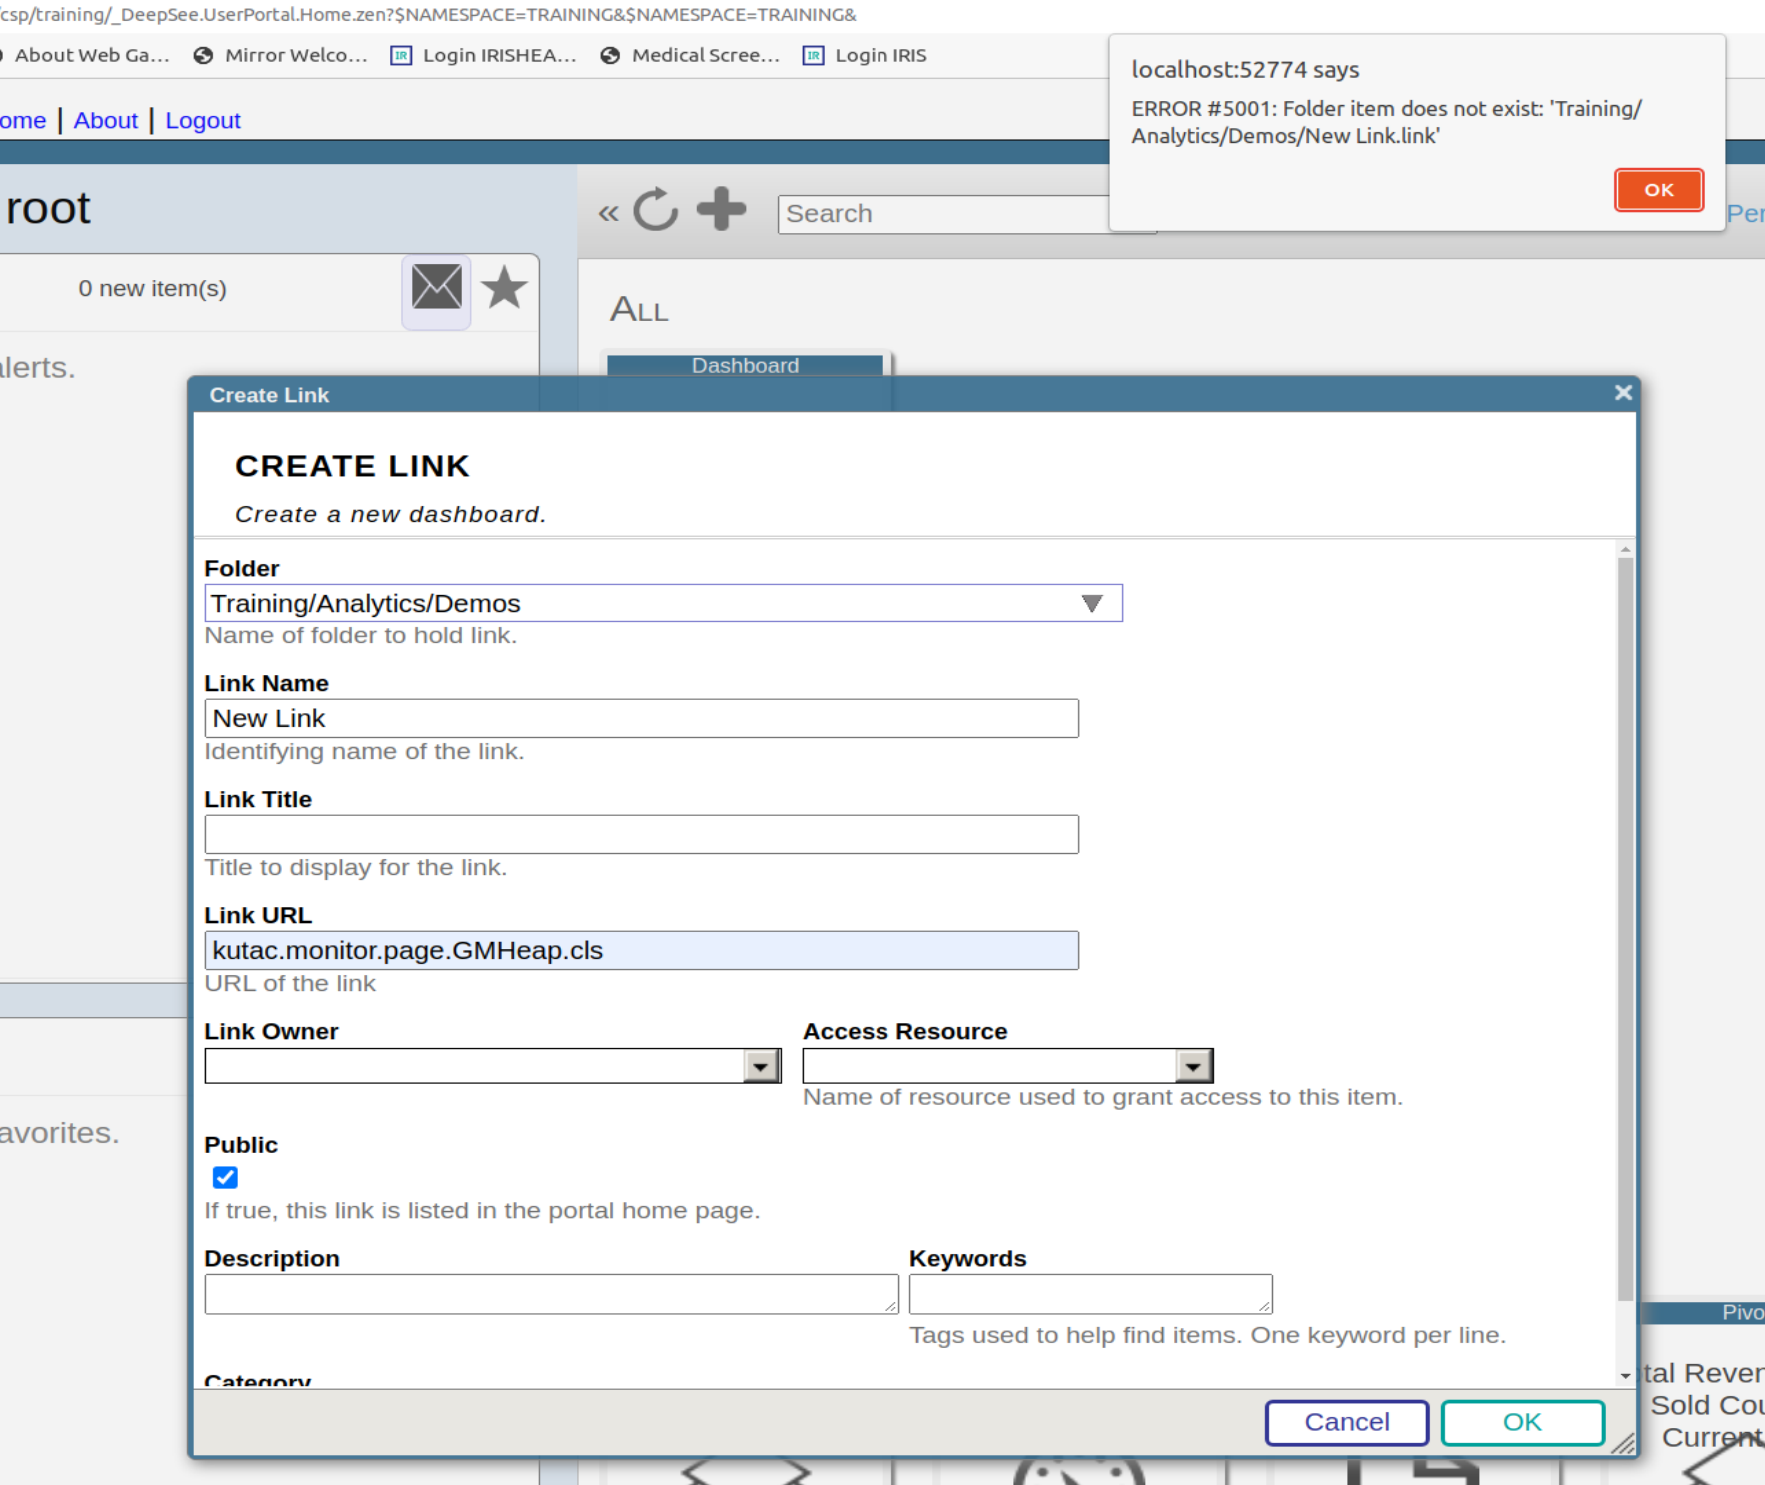
Our team is working on building dashboard for internal reference and monitoring.
We would like to have details like Interface Name, Current Status, Last Messages Processed at, IP & Port, Serve/Instance/Production Environment name etc.
If there is any built-in service which we can utilize or any pre-compiled code that we can utilize to build such dashboard.
At this moment want to keep it basic, but moving forward will enhance with more advance features.
I need an example of what I need to "map" to have a common dashboard defined so it will visible/usable in multiple namespaces.
I have created a dashboard in "SAMPLES" (namespace and database) and I would like to have this dashboard be accessable/useable from a 2nd namespace, but I'm not having any success in doing mappings (global/package/routine/data) to be able to get DeepSee to be able to see/display the dashboard.
I would like to pass multiple values of a FILTER from one DeepSee DASHBOARD to another DeepSee DASHBOARD. The documentation indicate this can be done via an URL. Are there any examples this type of configuration?
I work on an ERP system and am trying to set up a dashboard according to a customer request. It's a pivot table with a few controls and filters, nothing too difficult, but I'm having some issues with drill down.
Presenter: André Cerri Task: Use third-party visualization tools to present your DeepSee data Approach: Use DeepSee REST services to access DeepSee data from third-party tools
Come see examples of how you can use popular 3rd party data visualization tools to access your DeepSee data.
Content related to this session, including slides, video and additional learning content can be found here.
Aside from doing a print to PDF is there any way to use the existing DeepSee "export to PDF" functionality to export the entire dashboard rather than each individual pivot or chart?
This year while at the Global Summit, I came to learn of a component that Stephen Morrison of Intersystems had written that was capable of infusing SVG content into a PDF document. Apparently Stephen was approached about this and was amenable to sharing the code with us as we have recently encountered a similar need. I'm hoping this post will lead to the sharing of this utility code, so that we can determine if it will indeed suit our need.
What would be the easiest or best way to filter the options presented by a filter control?
For example, suppose that I create a query using HoleFoods that uses a named filter to filter the product categories according to some criteria. When I display the query on the dashboard, I would like to provide a filter control that will allow users to further constrain the product categories. However, a simple filter control will display all the product categories available in the cube many of which are irrelevant to the current query.
Hello, I've completed this tutorial: https://community.intersystems.com/post/deepsee-period-date-vs-same-peri... I've used the "year" level instead of a pivot variable. I want to calculate something like the following variation: 100 * ([DateOfSale].[PTD] - [DateOfSale].[LYPTD]) / [DateOfSale].[LYPTD] I create a new calculated member, under the same dimmension with the above expression.
I want to create a dashboard with a line graph that shows system availability over time. I used this code to create a Dashboard:
            Set tItem = ##class(%DeepSee.UserLibrary.Link).%New()
                Set tItem.fullName = "Availability"
                Set tPage = "Availability.UI.CSVImport.zen"
                Set tItem.href = $system.CSP.GetPortalApp($namespace,tPage)_tPage
                Set tItem.title = "Availability"
                Set tSC = tItem.%Save()
Scenario-1: How to add filter or where clause while displaying data with listing fields ( I have not used Custom SQL listing to display this data).
For below table, I have created a Cube Student and I have created listing fields of the columns mentioned in the table. Also I have created the pivot and I am able to create the same table as shown below.
Hi, I'm new to the Analytics world in Intersystems and was attempting to print and/or export selected rows from a detail listing in a pivot on a dashboard. I am able to print and/or export all the rows; but if I select a specific set of rows, it prints out the entire detail listing; not the selected rows. Please advise on the best approach to accomplish this task. Thanks.
 By likes
.png)