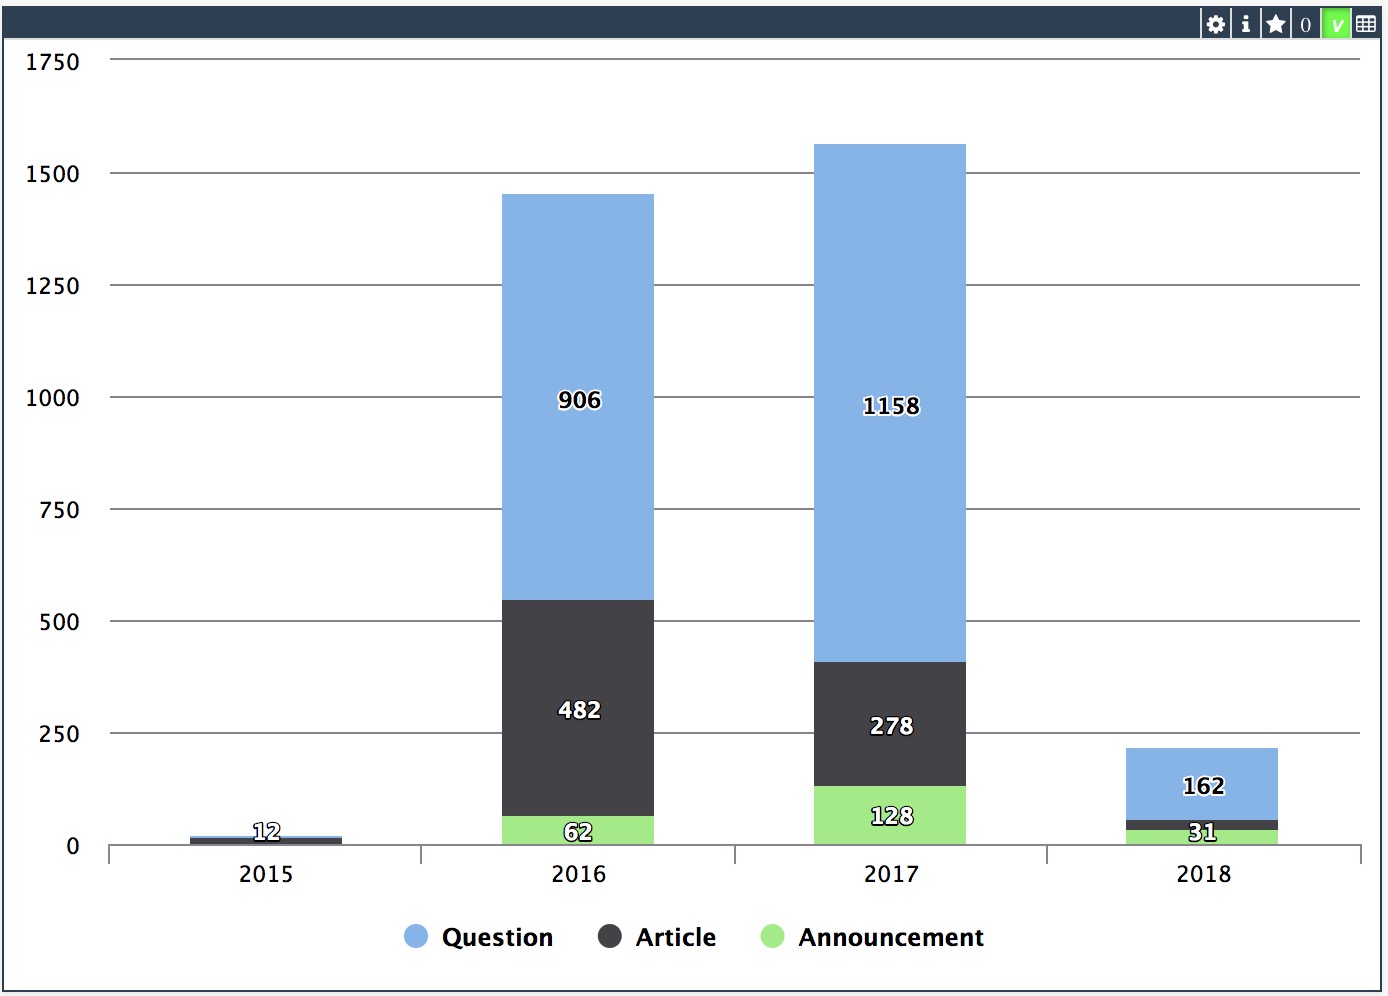
As said in the previous article about the iris-fhir-generative-ai experiment, the project logs all events for analysis. Here we are going to discuss two types of analysis covered by analytics embedded in the project:

2 0
1 261

Hi Community,

Dive into the new video on InterSystems Developers YouTube:

Near Real-Time Analytics with InterSystems IRIS & Debezium Change Data Capture @ Global Summit 2023

https://www.youtube.com/embed/MdPSTatJo9I
[This is an embedded link, but you cannot view embedded content directly on the site because you have declined the cookies necessary to access it. To view embedded content, you would need to accept all cookies in your Cookies Settings]

1 0
0 201

Hey, Community,

Enjoy the new video on InterSystems Developers YouTube:

A Whirlwind Tour of the Analytics Buffet @ Global Summit 2024

https://www.youtube.com/embed/A4qAbMMQMaA
[This is an embedded link, but you cannot view embedded content directly on the site because you have declined the cookies necessary to access it. To view embedded content, you would need to accept all cookies in your Cookies Settings]

0 0
0 53

We’re now less than a month away from our annual conference, the InterSystems Global Summit. This year, we’ll be descending on the beautiful outskirts of San Antonio, a city worth visiting for its wonderful river walkway and its 18th century Spanish Mission, even if it hadn’t been the location of this year’s InterSystems event. Leaving the tourist guidance to the tourist guides, let’s take a closer look at what the conference has in stock for you, including a dedicated post-summit symposium on AI and ML on Wednesday October 3!

4 0
0 320
Article
· Dec 31, 2019 3m read
Portlets that use data from DeepSee


In the previous part of this series, we saw how to reference a web page that will enhance our dashboard experience. Now we will look into referencing data that is already in our cubes.

In this example, we will be referencing the controller object and we will be extracting data from it. This data will then be displayed as text in our Dashboard. In Part 5, we will show how to incorporate this data into other charting libraries.

2 0
0 266

Hey Developers,

Watch the new video on InterSystems Developers YouTube:

Adaptive Analytics in InterSystems IRIS

https://www.youtube.com/embed/OJ207izcgio
[This is an embedded link, but you cannot view embedded content directly on the site because you have declined the cookies necessary to access it. To view embedded content, you would need to accept all cookies in your Cookies Settings]

1 0
0 209

What is %SQLRESTRICT

%SQLRESTRICT is a special %FILTER clause for use in MDX queries in InterSystems IRIS Business Intelligence. Since this function begins with %, it means this is a special MDX extension created by InterSystems. It allows users to insert an SQL statement that will be used to restrict the returned records in the MDX Result Set. This SQL statement must return a set of Source Record IDs to limit the results by. Please see the documentation for more information.

Why is this useful?

This is useful because there are often times users want to restrict the results in their MDX Result Set based on information that is not in their cubes. It may be the case that this information may not make sense to be in the cube. Other times this can be useful when there is a large set of values you want to restrict. As mentioned before, this is not a standard MDX function, it was created by InterSystems to handle cases were queries were not performing well or cases that were not easily solved by existing functions.

6 0
2 683

In Episode 7 of Data Points, product manager @Carmen Logue joined the pod to tell us all about InterSystems Reports — the new reporting feature of InterSystems IRIS! Take a listen to hear about its capabilities, use cases, and how it fits into the existing set of analytics technologies.

https://5e18edf067eb59-03854285.castos.com/player/172127
[This is an embedded link, but you cannot view embedded content directly on the site because you have declined the cookies necessary to access it. To view embedded content, you would need to accept all cookies in your Cookies Settings]

1 0
0 262

Hi Community!

Enjoy watching the new video on InterSystems Developers YouTube:

Introduction to InterSystems Reports

https://www.youtube.com/embed/-AdK9sOwk50
[This is an embedded link, but you cannot view embedded content directly on the site because you have declined the cookies necessary to access it. To view embedded content, you would need to accept all cookies in your Cookies Settings]

2 0
0 242

Hi Community,

See a demonstration of InterSystems IRIS Adaptive Analytics and get a detailed description of this new offering for analytics end-users:

Demonstration: Adaptive Analytics in InterSystems IRIS

https://www.youtube.com/embed/mmT5g8G-8Bo
[This is an embedded link, but you cannot view embedded content directly on the site because you have declined the cookies necessary to access it. To view embedded content, you would need to accept all cookies in your Cookies Settings]

1 0
0 230

One of the most important tasks of dashboards is, on the one hand, to help you perceive data in an aggregated form, and, on the other hand, not to lose the depth of immersion in the data if you need this. One of the tools that help us achieve this result is drill down. It enables us to display several hierarchical levels of data, from aggregated to detailed.

5 0
0 549

Hi all. We are going to find duplicates in a dataset using Apache Spark Machine Learning algorithms.

Note: I have done the following on Ubuntu 18.04, Python 3.6.5, Zeppelin 0.8.0, Spark 2.1.1

Introduction

In previous articles we have done the following:

0 0
1 727

This year's Virtual Summit has more content around Analytics and AI than ever before. We've made this quick video to guide you through the program and put things into context with respect to InterSystems overall strategy for Data & Analytics.

https://www.youtube.com/embed/fTcNimWi2y0
[This is an embedded link, but you cannot view embedded content directly on the site because you have declined the cookies necessary to access it. To view embedded content, you would need to accept all cookies in your Cookies Settings]

6 0
0 270

Web Crawling is a technique used to extract root and related content (HTML, Videos, Images, etc.) from websites to your local disk. This is allows you apply NLP to analyze the content and get important insights. This article detail how to do web crawling and NLP.

To do web crawling you can choose a tool in Java or Python. In my case I'm using Crawler4J. (https://github.com/yasserg/crawler4j).

1 0
1 876

Hello all,

I'm trying to build a cube based on a linked table but seems that IRIS is not able to do it :O

Long story short, I have a linked table in IRIS that sources a Microsoft SQL table (using standard linked feature from the portal). It works fine, I can access it using SQL as many other times. On top of that, I've created in DeepSee (ok, Analytics) a cube that uses this class as source. It compiles correctly, no errors given. When I build it with 100 records, all goes well and using Analyzer I can see results.

0 0
0 163

Hi, Community!

This is the 3rd part of DeepSee Web story - Angular base UI for DeepSee Dashboards, see the beginning here.

By design, DSW provides an implementation for every widget in DeepSee library. But there are some extra features in DSW which make solutions built with DSW dashboards more functional. This article describes it.

2 0
1 1K

Users of analytical applications often need to generate and send out PDF reports comprised of elements of the analytical panel. In the InterSystems stack, this task is solved using the DSW Reports project that is an extension of DeepSeeWeb. In this article, we will explain how to use DSW Reports for generating PDF reports and emailing them.

1 0
1 611

When using Related Cubes in InterSystems IRIS BI, cubes must be built in the proper order. The One side must be built before the Many side. This is because during build time for the Many side, it looks up the record on the One side and creates a link. If the referenced record is not found on the One side, a Missing Relationship build error is generated. The One side is going to be the independent side of the relationship, AKA the side of the relationship that is referenced by the Many side or the Dependent cube. For example: Patients contain a reference to their Doctor.

3 0
0 548

Episode 17 of Data Points features a roundtable conversation with Carmen Logue, Benjamin De Boe, and Thomas Dyar about the Analytics & AI area of the InterSystems technology stack. Learn from these product experts about the various technologies and partnerships that exist within the Analytics & AI space at InterSystems, how some customers use these tools, and what might be coming in the future.

https://5e18edf067eb59-03854285.castos.com/player/408391
[This is an embedded link, but you cannot view embedded content directly on the site because you have declined the cookies necessary to access it. To view embedded content, you would need to accept all cookies in your Cookies Settings]

1 0
1 212
Article
· Aug 13, 2021 4m read
Building Analytics Solution with IRIS

Hi developers!

How to build an analytics solution with InterSystems IRIS?

To begin with, let's agree on the points of what is the analytics solution - and this could be a very wide topic. Let's limit the set of solutions to those you can present in the Analytics contest.

There are three kinds of analytics solutions that we will review here: monitoring, interactive analytics, and reporting.

Monitoring

The typical monitoring solution consists of an online dashboard with KPIs that are being actively updated.

The key use case is of monitoring is to visually observe the KPI of fresh data every moment to react in case of an emergency.

Interactive Analytics

This solution supposes a set of interactive dashboards with filters and drill-downs.

The key use case is to explore the data with filters and drill-downs making business decisions upon graph and table data visualization.

Reporting

Reporting solution provides a set of static (usually) reports in a form of HTML or pdf documents that deliver the data in graph and text form in a predesigned form and could be sent via email.

The typical use case of a reporting system is to obtain reports on a given period that will illustrate the status of the product, process, service, sales, etc that is crucial for the business.

How InterSystems products could be used to build such solutions? Let's discuss this below!

3 0
1 461

Hey Community,

See how cubes are constructed for use in business intelligence, and learn about SQL and MDX query languages. Physical and virtual cubes are used in InterSystems IRIS® Business Intelligence and Adaptive Analytics:

Introduction to Cubes in Business Intelligence

https://www.youtube.com/embed/l6XFj1JQ5Fw
[This is an embedded link, but you cannot view embedded content directly on the site because you have declined the cookies necessary to access it. To view embedded content, you would need to accept all cookies in your Cookies Settings]

4 0
0 368
Article
· Sep 9, 2022 1m read
DC Analytics Open Application

InterSystems Developer Community analytics. Project made with InterSystems IRIS BI (DeepSee), Power BI and Logi Report Designer to visualize and analyze members, articles, questions, answers, views and other pieces of content and activity on InterSystems Developer Community.

You can see your own activity, articles and questions. Track how your contribution changes developer community.

2 0
0 300

When analyzing data, there is often a need to look at specific indicators more thoroughly and to highlight sections of information of particular interest to a user.

For instance, examining the data dynamics for specific regions or dates can help us uncover some hidden trends and patterns that will allow us to make an informed decision about our project in the future.

2 0
1 404