Announcement
· Mar 15, 2021
FHIR Analytics

Hi developers,

We have received quite a lot of interest in using SQL on FHIR data. As you know, FHIR data is encoded in the form of a complex directed graph, and thus you can not easily query it with traditional SQL queries or business intelligence tools. Some customers have noticed that the "FHIR search tables" in IRIS for Health have flattened part of the FHIR graph, and have tried to use them for analytics. This is an undocumented and unsupported part of IRIS for Health, and can change without notice.

10 1
0 416

Hello community, I need to solve a complex but trivial issue.

Given:

Two tables "Comment" and "Post". Each one contains an "Author" field, which is essentially a user ID. In these tables, each user ID represents an author. The goal is to count all participants together and then group them by month, language, and other metrics.

The question is how to do this within the IRIS ecosystem. Is it even possible to take two tables, get distinct data from them and then combine into one cube?

0 1
0 190

Hi Community,

The new video is available on InterSystems Developers YouTube Channel:

Collecting Healthcare Data with Alexa

https://www.youtube.com/embed/tl7heBWRrVQ
[This is an embedded link, but you cannot view embedded content directly on the site because you have declined the cookies necessary to access it. To view embedded content, you would need to accept all cookies in your Cookies Settings]

0 1
0 302

Dear Folks,

I have recently studied deepsee and developed few dashboards needed for our web app users. I am trying to embed them in our existing web app which uses angular with delegated user access. I need to embed the native IRIS dashboard into it. ( I can't use Highcharts or any other js tools).

How do I setup the dashboards to work with delegated authentication (Without providing access to management portal or other parts) ? Also should I use the default csp/{Namespace}/_DeepSee.UserPortal.DashboardViewer.zen? or any other web application URL ?

Thanks

0 1
0 213

Preview releases are now available for InterSystems IRIS Advanced Analytics, and InterSystems IRIS for Health Advanced Analytics! The Advanced Analytics add-on for InterSystems IRIS introduces IntegratedML as a key new feature.

9 1
3 636

Hi, Community!

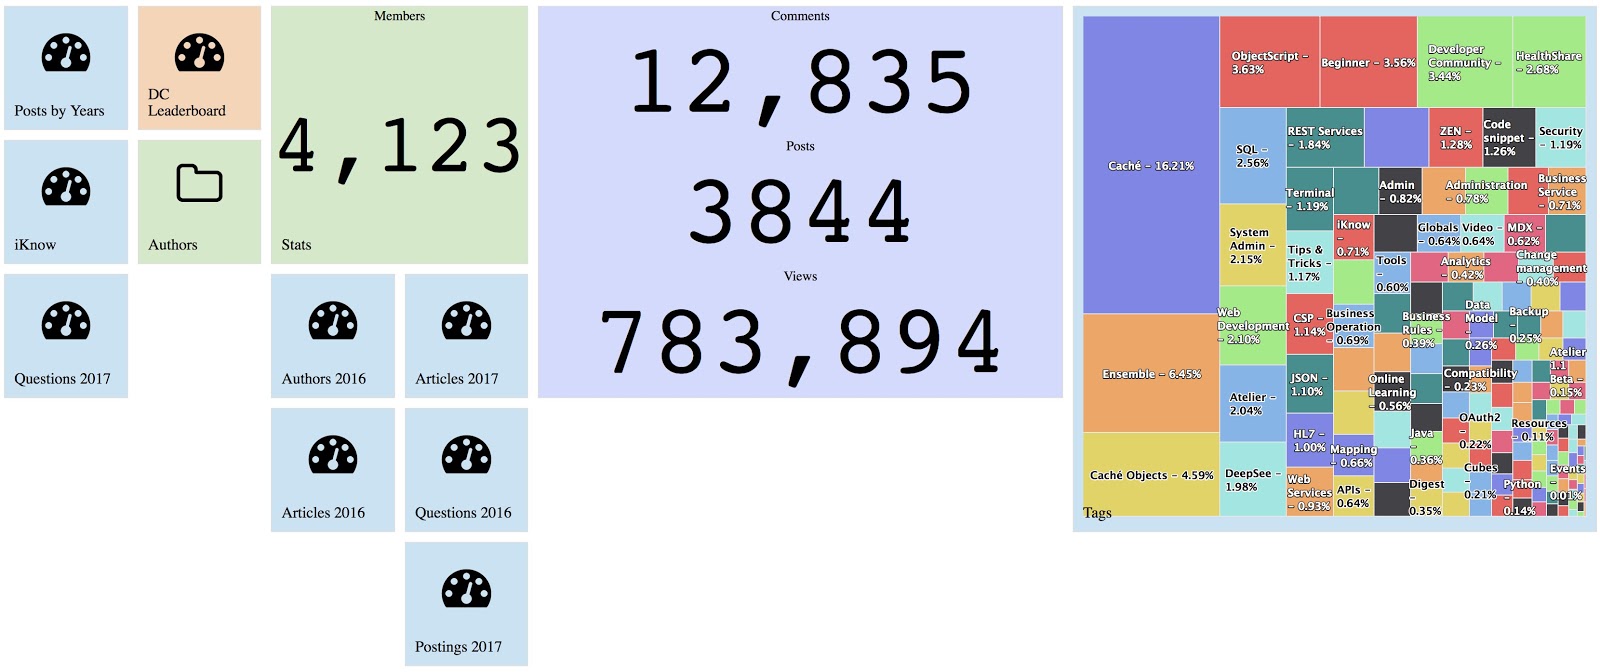
I’m sure you are using Developer Community analytics built with InterSystems Analytics technology DeepSee:

You can find DC analytics n InterSystems->Analytics menu.

DC Analytics shows interactive dashboards on key figures of DC entities: Posts, Comments, and Members.

Since the last week, this analytics project is available for everyone with source code and data on DC Github!

2 1
1 637

I want to have a generic PercentOfAll measure that can be used for any dimension of the cube. This PercentOfAll should act like Count, but instead of showing the number of rows in a cell, it will show the percentage (100*number of rows for that member/all rows) .It should not matter what dimension is being viewed. Ex

There are a total of 100 rows in the source class.

1 1
0 374

Making a Chart using Intersystems IRIS + Python

How to use the IRIS Native API in Python to access globals and plot some charts.

Why Python?

With a large adoption and use in the world, Python have a great community and a lot of accelerators | libraries to deploy any kind of application.
If you are curious (https://www.python.org/about/apps/)

4 1
0 472

When we are at the starting stage of BI project development, we must remember that it is crucial to select the right tool for its implementation. Today we want to show you how one of the principal functionality of dashboards is implemented in different BI systems. Let's talk about drill down from both points of view: the dashboard development, and the convenience and clarity for the end user. We will touch on the applications of this technology in IRIS BI, Power BI and Tableau.

3 1
0 815

Creating information dashboards, pivot tables, and widgets is an important step in analysis that provides valuable sources of information for informed decision-making. The IRIS BI platform offers many opportunities to create and customize these elements. In this article, we will take a closer look at the basic techniques for developing them and the importance of using them.

7 1
0 487

Hey Developers,

Learn about InterSystems Reports, powered by Logi Analytics, a report-generation tool that enables you to rapidly create and view visual reports of your data.

A Look at InterSystems Reports

https://www.youtube.com/embed/mmA5ArAMLSU
[This is an embedded link, but you cannot view embedded content directly on the site because you have declined the cookies necessary to access it. To view embedded content, you would need to accept all cookies in your Cookies Settings]

3 1
0 373

This article contains the tutorial document for a Global Summit academy session on Text Categorization and provides a helpful starting point to learn about Text Categorization and how iKnow can help you to implement Text Categorization models. This document was originally prepared by Kerry Kirkham and Max Vershinin and should work based on the sample data provided in the SAMPLES namespace.

5 0
1 728

I was using PowerBI to create regular display data obtained from one popular web sourse with hundreds of thousands of visitors per month and a big number of users.

At the beginning of that visualisation development, I was using direct connection from Power BI to Adaptive Analytics powered by AtScale. Adaptive Analytics is useful for cached data, aggregates and fast data sources switching between development and stage phases. The “AtScale cubes'' connection method was used:

3 0
0 991

Hi Community,

Watch this video to see InterSystems IRIS in action as it is applied to real-world use cases, including business 360 and real-time analytics processing:

InterSystems IRIS Live Demos @ Global Summit 2022

https://www.youtube.com/embed/pntzJY4pgA8
[This is an embedded link, but you cannot view embedded content directly on the site because you have declined the cookies necessary to access it. To view embedded content, you would need to accept all cookies in your Cookies Settings]

0 0
0 448

Hi, Community!

This week we have two videos.

Please find the second Developer Community Video of the week on InterSystems Developers YouTube Channel:

Turning Accountants into Explorers

https://www.youtube.com/embed/2wG17vzXTy4
[This is an embedded link, but you cannot view embedded content directly on the site because you have declined the cookies necessary to access it. To view embedded content, you would need to accept all cookies in your Cookies Settings]

1 0
0 313

Hi Community,

New session recording from Global Summit 2019 is available on InterSystems Developers YouTube Channel:

The Data Management and Analytics Landscape

https://www.youtube.com/embed/wuuCQ6erMFs
[This is an embedded link, but you cannot view embedded content directly on the site because you have declined the cookies necessary to access it. To view embedded content, you would need to accept all cookies in your Cookies Settings]

1 0
0 193

Hello Community,

Thank you all for your continued feedback and support of our ad hoc reporting platform, VDM. There's been some questions around setting up a non-ODBC connection for InterSystems platforms. We published a new YouTube video showing the steps necessary to connect to InterSystems Caché and InterSystems IRIS with BridgeWorks VDM.

2 0
3 260

Now available on Open Exchange is a library of third party charts available to use within DeepSee/InterSystems IRIS BI dashboards. To start, simply download and install, select the new portlet as the widget type, then select the chart type that you desire. If you don't find the type of chart you are looking for, you can easily extend the portlet to implement your desired chart type. These new chart types can be used within existing dashboards or you can create new dashboards using them.

4 0
0 1.1K

With the improvement of living standards, people pay more and more attention to physical health. And the healthy development of children has become more and more a topic of concern for parents. The child's physical development can be reflected from the child's height and weight. Therefore, it is of great significance to predict the height and weight in a timely manner.

1 0
1 205

Hi Developers,

Watch this video to learn about some recent machine learning engagements InterSystems is driving, including TrakCare predictive analytics and examples from our Developer Community and partners:

Artificial Intelligence Healthcare Solutions - Time to Take Action @ Global Summit 2023

https://www.youtube.com/embed/Xminu9GmwEc
[This is an embedded link, but you cannot view embedded content directly on the site because you have declined the cookies necessary to access it. To view embedded content, you would need to accept all cookies in your Cookies Settings]

0 0
0 251

Hi Community,

This week we have two new videos from Global Summit 2019. Please welcome:

1. An ML Toolkit for InterSystems IRIS: Co-Innovation in Healthcare

https://www.youtube.com/embed/o0T0AgvxaNk
[This is an embedded link, but you cannot view embedded content directly on the site because you have declined the cookies necessary to access it. To view embedded content, you would need to accept all cookies in your Cookies Settings]

0 0
0 321

Preview Mode was added to InterSystems IRIS Business Intelligence to give designers a quick view of what their resulting Pivot Table will look like without needing to wait for the results to fully execute. This can be beneficial when designing pivot tables because if you are dragging and dropping elements to see how they look/work in your pivot table and seeing if they have the desired data. Since you are exploring and designing, you don't necessarily care about the results at the moment, but you would still like to see how your table looks with the changes you have made.

2 0
0 393
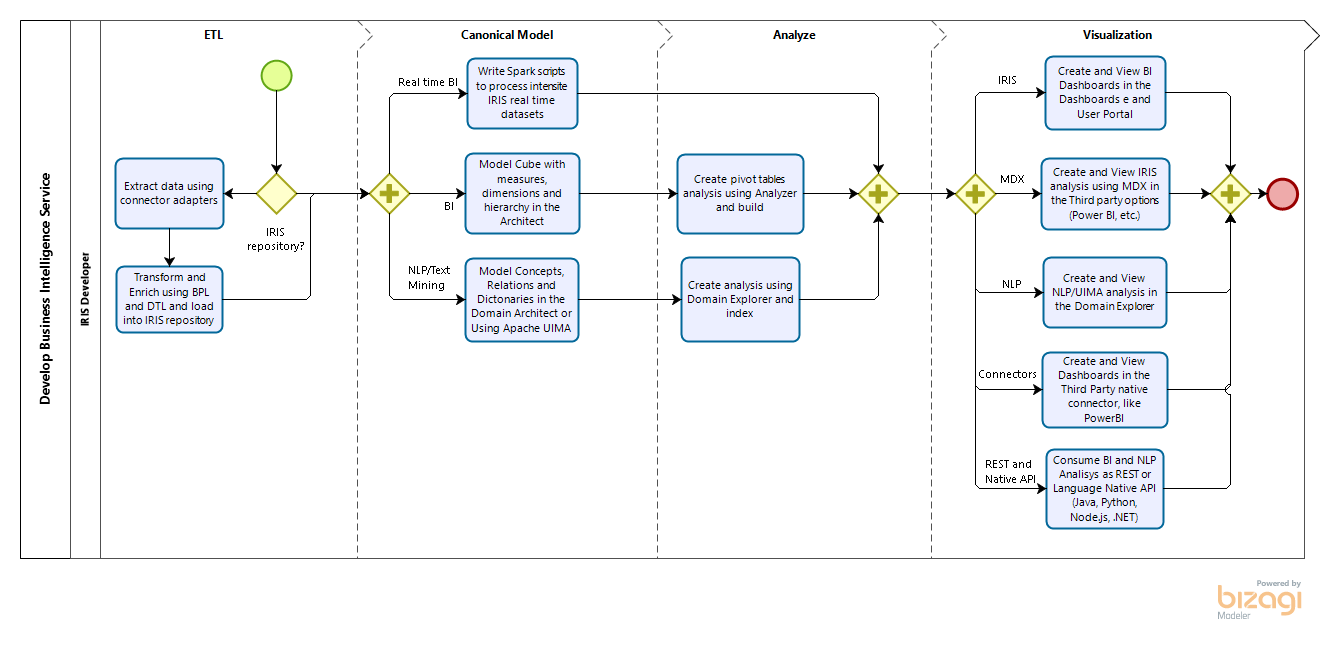
Article
· Nov 20, 2020 2m read
Enrich your analytics projects with NLP

According IDC, 80% of all data produced are NoSQL. See:

There are digital documents, scanned documents, online and offline texts, blob content into SQL, images, videos and audio. Imagine a Corporate Analytics initiative without all these data to analyze and support decisions?

In all the world, many projects are using techonologies to transform these NoSQL data into textual content, to allows analyze it. See:

2 0
2 293

The release of InterSystems IRIS 2021.1 introduces Adaptive Analytics. To get started with a familiar InterSystems IRIS BI sample cube, we have created a HoleFoods Sample Application for Adaptive Analytics. This Sample Application is available on Open Exchange. There is also a learning services course available to learn more about Adaptive Analytics.

3 0
0 268