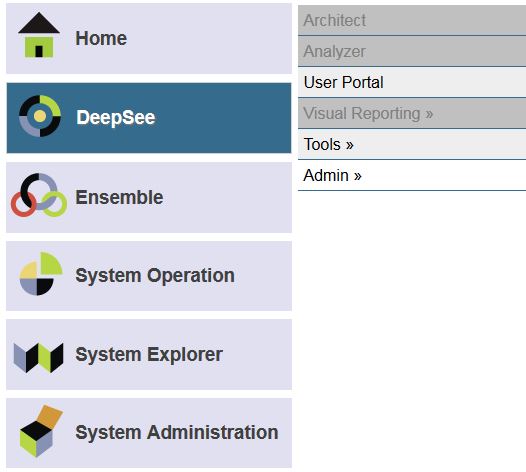
With the release of InterSystems IRIS, we're also making available a nifty bit of software that allows you to get the best out of your InterSystems IRIS cluster when working with Apache Spark for data processing, machine learning and other data-heavy fun. Let's take a closer look at how we're making your life as a Data Scientist easier, as you're probably already facing tough big data challenges already, just from the influx of job offers in your inbox!

2 2
0 1.5K

Apache Spark has rapidly become one of the most exciting technologies for big data analytics and machine learning. Spark is a general data processing engine created for use in clustered computing environments. Its heart is the Resilient Distributed Dataset (RDD) which represents a distributed, fault tolerant, collection of data that can be operated on in parallel across the nodes of a cluster. Spark is implemented using a combination of Java and Scala and so comes as a library that can run on any JVM.

11 5
1 2.6K

Hi, Community!

This is the 3rd part of DeepSee Web story - Angular base UI for DeepSee Dashboards, see the beginning here.

By design, DSW provides an implementation for every widget in DeepSee library. But there are some extra features in DSW which make solutions built with DSW dashboards more functional. This article describes it.

2 0
1 793

Last week, we announced the InterSystems IRIS Data Platform, our new and comprehensive platform for all your data endeavours, whether transactional, analytics or both. We've included many of the features our customers know and loved from Caché and Ensemble, but in this article we'll shed a little more light on one of the new capabilities of the platform: SQL Sharding, a powerful new feature in our scalability story.

13 11
1 1.5K

System Monitor is a flexible and highly configurable tool supplied with Caché (Ensemble, HealthShare), which collects the essential metrics of the operating system and Caché itself. System Monitor also notifies administrators about issues with Caché and the operating system, when one or several parameters reach the admin-defined thresholds.

1 2
2 1.3K
Article
· May 25, 2017 2m read
The Interns are Coming!

The Data Platforms department here at InterSystems is gearing up for this year's crop of interns, and I for one am very excited to meet them all next week!

We've got folks from top technical colleges with diverse specialties from hard core engineers to pure computer scientists to mathematicians to business professionals. They come from countries around the world like Vietnam, China, and Finland and they all come with impressive backgrounds. We're sure they will do very well this summer.

6 0
0 478

How are we doing THIS year versus the same period LAST year?
This is a common need in Business Intelligence. In fact, many design specifications for reports make use of a comparison between a selected period (year, quarter, etc) up to a certain date (for example November 15th, 2016) and a summary of the same information for the previous year (i.e. up to November 15th, 2015).
This post shows how to implement this in DeepSee.

6 8
0 1.7K

Whether you are accessing DeepSee for the first time ever or you are configuring DeepSee on a new instance, there are two common issues that are encountered after clicking on the “DeepSee” option in the System Management Portal.

Issue #1: Architect/Analyzer is grayed out!

Issue #2: DeepSee must be enabled before use.

Issue #1: Architect/Analyzer is grayed out!

There are two common causes for this problem.

5 1
0 1.5K

I've asked a lot of questions leading up to this, so I wanted to share some of my progress.

The blue line represents the number of messages processed. The background color represents the average response time. You can see ticks for each hour (and bigger ticks for each day). Hovering over any point in the graph will show you the numbers for that period in time.

This is super useful for "at a glance" performance monitoring as well as establishing patterns in our utilization.

5 2
0 482

This article contains the tutorial document for a Global Summit academy session on Text Categorization and provides a helpful starting point to learn about Text Categorization and how iKnow can help you to implement Text Categorization models. This document was originally prepared by Kerry Kirkham and Max Vershinin and should work based on the sample data provided in the SAMPLES namespace.

5 0
1 640