Just wonder if I could have some ways adding a percentage of weekly delta over the previous one on the top of each stacked bar in a bar chart widget like the one below.
.png)
InterSystems Business Intelligence enables you to embed business intelligence (BI) into your applications so that your users can ask and answer sophisticated questions of their data. Specifically, your application can include dashboards, which can include the following:
In contrast to traditional BI systems that use static data warehouses, Business Intelligence is kept closely in synchronization with the live transactional data, as required for your business.
Just wonder if I could have some ways adding a percentage of weekly delta over the previous one on the top of each stacked bar in a bar chart widget like the one below.
Hi Everyone,
We are using SQL based KPI's to display reports in IRIS dashboards. We have applied the filter functionality in these SQL based KPI reports.
I need your help for below scenario.
Below is my full report. Filter is applied on Name and Subject Name in this report.
.png)
Now I have used filter on Name and selected values 'Virat' and 'Big Show'
.png)
2 entries were displayed from 5 records.
.png)
Now when I look in Subject Name Filter, it still display all the distinct values of Subject Name.
.png)
I want this to display only Chemistry and Social (as Name filter got applied).
Using InterSystems Embedded Analytics – Virtual April 15-19, 2024
Hi Community,
I have below scenario
We have IRIS BI Reports in my application. I want to create a automated backend utility (similar to background cache system task) which run these bi reports and export them to PDF at a specific path. In dashboard we have defined <property name="print">1</property> which allows report export to PDF.
Now I want to debug the code (line by line) from dashboard to %DeepSee.UI.MDXPDF.cls but I am not sure is this possible or not.
Please suggest. Thanks in advance!
Hi Community,
Play the new video on InterSystems Developers YouTube:
⏯ InterSystems IRIS Business Intelligence - Tips & Tricks @ Global Summit 2023
Hi Community,
I have below scenario
We have IRIS BI Reports in my application. Now these reports currently being acessed by users through dashboard url's.
I want to create a automated utility (background cache system task) which run these bi reports and export them to a specific path.
I am looking for a system method through which we can open these dashboard url's through code and export the excel report to a speciific path.
Thanks in advance.
Hello everyone,
I am new to Deepsee (BI intelligence) concepts in IRIS. I am looking for a solution of below question
Question: We have a server where we are currently storing archive PDF reports of our application.
We want to add and view these archive reports (PDF format only) in dashboards. Is there any way we can do this? Or any article which can help us performing this task.
Thanks in advance!!
Hello all,
Currently I am trying to create a pivot table based on a cube with several calculated measures that perform a distinct member count, as in https://docs.intersystems.com/iris20231/csp/docbook/DocBook.UI.Page.cls… . However, when I add these measures as the columns of the pivot table, the resulting row generation step can take a long time (at least five minutes). This includes row generation when performing drill-downs.
Creating information dashboards, pivot tables, and widgets is an important step in analysis that provides valuable sources of information for informed decision-making. The IRIS BI platform offers many opportunities to create and customize these elements. In this article, we will take a closer look at the basic techniques for developing them and the importance of using them.
Dashboards are visual tools that combine different data in one interface for more effective monitoring and analysis.
When analyzing data, there is often a need to look at specific indicators more thoroughly and to highlight sections of information of particular interest to a user.
For instance, examining the data dynamics for specific regions or dates can help us uncover some hidden trends and patterns that will allow us to make an informed decision about our project in the future.
To conduct such a detailed data analysis, the most effective thing to do would be to use the "fractional analysis" method or drill-down analysis.
Hi Community,
.png)
to learn quickly and in total autonomy on IRIS, I offer you some links which can help you in this beautiful bicycle ride rich in discoveries:
Hello Community,
Anyone who has (near or distant, with a preference for the 1st option) knowledge of the use of Amazon QuickSight with IRIS is invited to share his|her experience in this discussion.
Thanking you in advance.
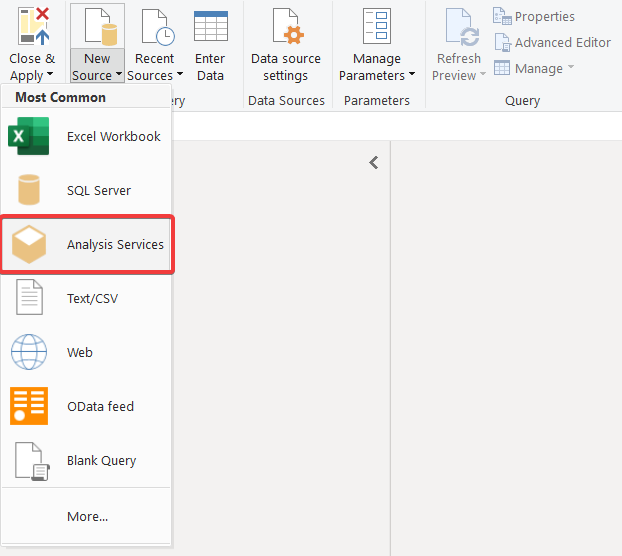
To connect to AtScale, we will use the SQL Server Analysis Services database. Let's open it in the Power Query editor. To do that, select Transform Data on the Home.
In the window that appears, go to the Home, expand New Source and select Analysis Services.
As said in the previous article about the iris-fhir-generative-ai experiment, the project logs all events for analysis. Here we are going to discuss two types of analysis covered by analytics embedded in the project:
In order to extract useful data to apply analytics, we used the iknowpy library - an opensource library for Natural Language Processing based in the iKnow for IRIS Data Platform. It makes possible identifies entities (phrases) and their semantic context in natural language text in several languages.
Hi Developers!
Often solutions with InterSystems IRIS BI can turn into a quite big solution with dozens of pivots and dashboards.
With every new IRIS BI solution release we can add changes that could influence the behavior of existing pivots or dashboards so they stop working. For example if we change the dimension or measure name, forget deploying some cubes or subject areas, conduct refactoring via mass renaming of cubes and its elements etc some widgets could stop functioning.
The solution is to test (manually?) every widget in every dashboard if the MDX queries are working.
How can I create a calculated member in Analyzer using MDX for the following logic?
WHEN 'F' THEN 'FEMALE'
WHEN 'Female' THEN 'FEMALE'
WHEN 'M' THEN 'MALE'
WHEN 'Male' THEN 'MALE'
WHEN 'U' THEN UNDIFFERENTIATED'
WHEN 'UN' THEN UNDIFFERENTIATED'
WHEN 'Undifferentiated' THEN UNDIFFERENTIATED'
ELSE 'OTHER'
END
Suppose I created a new DeepSee class to display a new item in the dashboard.
DeepSee.Component.datePickWich, in general, is just a copy of a similar class in %ZEN with minor changes. I need to include it in the base install. How can i do this? Am I ever allowed to change the composition of system classes?
I built a dashboard to show hourly instrument capacities based on a term list. The term list consists of the TestInstrumentID and the number of tests that instrument can perform in 1 hour. The calculation works correctly and the data is accurate but periodically if you go to check the dashboard the percentages all get changed to 100% across every hour. If you check it later or add an additional site to the filter then the percentages correct themselves. I don't know what's causing this or how to troubleshoot it because it does calculate correctly but is not consistent.
Using InterSystems Embedded Analytics March 6-10, 2023 – Virtual 9:00am-5:00pm US-Eastern Time (EST)
This course is offered only a few times each year so take advantage of this session!
Overview
With the gradual improvement of hospital information construction, there are more and more business interfaces in hospitals. Due to the influence of various factors (network, consumer system, etc.), the data processing of business interface may cause excessive message accumulation and even the situation of interface card congestion, which affects the normal business development in the hospital. Therefore, the monitoring of the queue of business interface components becomes more and more important.
1. Overview
With more and more hospital applications built, business interface data processing may be affected by a variety of factors (network, consumer systems, etc.), there is an excessive accumulation of messages or even cause interface lag, affecting the routine performance of hospital IT systems , so the monitoring of the business interface components queue is increasingly important.
While current Intersystems IRIS platform's built-in queue monitoring only displays real-time queue information for interface components, which is limited in providing the queue data information needed by hospitals. The queue monitoring component program is based on the Intersystems IRIS platform and can monitor all interface components and display component queue information within 24h of the component, as well as query component historical queue data by setting a time period to better meet the needs of current in-hospital applications.
When requesting /MDX2JSON/PivotVariables/Patients?Namespace Patients shoud be passed to a method but its not. When argument passed directly into the method it works.
Has something changed in IRIS and this syntax is deprecated, or is there a bug and the colon is ignored? What could it be?
This question is continuation from https://community.intersystems.com/node/534811
When requesting pivot variables from a cube, a 404 error is displayed. What's the problem? Is it IRIS or is it API?
<TITLE>Not Found</TITLE>
<H1>Not Found</H1>
The requested URL /MDX2JSON/PivotVariables/Patients was not found on this server.
Hi All,
I'm looking to write a 3rd party front end for BI cubes and have been directed towards the REST API here: https://docs.intersystems.com/iris20222/csp/docbook/DocBook.UI.Page.cls…
I've had quick test using postman and can use those fine, the issue I have is that there are some areas of metadata not exposed by the api that are essential to write a front end tool. I can list the cubes and measures using the /INFO/ paths, but that seems to be the limit of what is available.
Hi
I have a pvot table defined. that generates a set of data. I want. to. execute the pivot table programatically which I believe involves using %DeepSee.ResultSet. Does someone have an example showing how to apply filters to the results?
For. example
[DateTime of Filing].[Date].[Date Filed Year] = &[2023]
Thanks
does anyone have an example of using %DeepSee.Utils:%GetDimensionMembers where you want to apply certain filters
For example I have a date dimension that I want to get all of the months level but filtering for only a specific year.
Thanks
We offer you to embed business intelligence into your applications in order to give your users an opportunity to ask and answer sophisticated questions about their data. Typically, your application will include customizable dashboards that can provide insight into data from Business Intelligence models known as cubes.
In contrast with traditional BI systems that use static data warehouses, Business Intelligence keeps being constantly synchronized with the live transactional data.
We will use DeepSee User Portal as a dashboard builder and DeepSeeWeb - as the display of dashboards.
I would like to define an advanced filter within my pivot table that allows me to look at diagnosis codes, or at procedure codes - but I do not want to hard code values within the pivot table definition (get the %OR defined).
I would like to be able to allow my dashboard user to chose what specific diagnosis codes or procedure codes they are interested in. So for example one user may want to look for # of patients with cancer dx or patients who have had a radiation procedure.
How can I accomplish this OR feature using dashboard filters?
Developers, we have prepared a tutorial to get you started with InterSystems Adaptive Analytics powered by AtScale. In it, in addition to setting up AtScale and working with data cubes, we will also touch on methods of working with InterSystems Reports and other analytical systems.
Now the course is ready and we want to conduct a pilot training course on a small group of volunteers (3-5 people).
The course will be held in the form of two-hour classes for three consecutive days from 11/14/2022 to 11/16/2022. The time range is approximately 2pm to 6pm UTC+4 (Dubai).
Today we will talk about Adaptive Analytics. This is a system that allows you to receive data from various sources with a relativistic data structure and create OLAP cubes based on this data. This system also provides the ability to filter and aggregate data and has mechanisms to speed up the work of analytical queries.
.png)
Let's take a look at the path that data takes from input to output in Adaptive Analytics. We will start by connecting to a data source - our instance of IRIS.