gj :: locate was the entry from George James Software for the Developer Tools competition back in April 2021. When an ObjectScript error is reported, gj :: locate takes the .int line location and navigates you directly to the line in the source file where the error originated. Over the past few months we've found it a very useful tool when it comes to debugging, especially when used alongside the Serenji debugger in Visual Studio Code.

Our first update, version 1.1.0, now includes support for multi-root workspaces. This enables gj :: locate to be used with every workspace folder. If your VS Code workspace has more than one root level folder, connecting to different namespaces or perhaps different servers, then gj :: locate will determine which workspace folder is current and locate the source code in that folder. If your workspace doesn't have any files open then gj :: locate will prompt you to select a folder from a pick-list.

This will particularly benefit VS Code power users who have workspaces with simultaneous connections to multiple namespaces, on multiple different IRIS and Caché servers.

If you would like to try it out then you can download it from the VS Code marketplace. Or if you’re already a user, then gj :: locate will automatically update. Let us know how you're getting on with it!

2 0
1 202

Hey Developers,

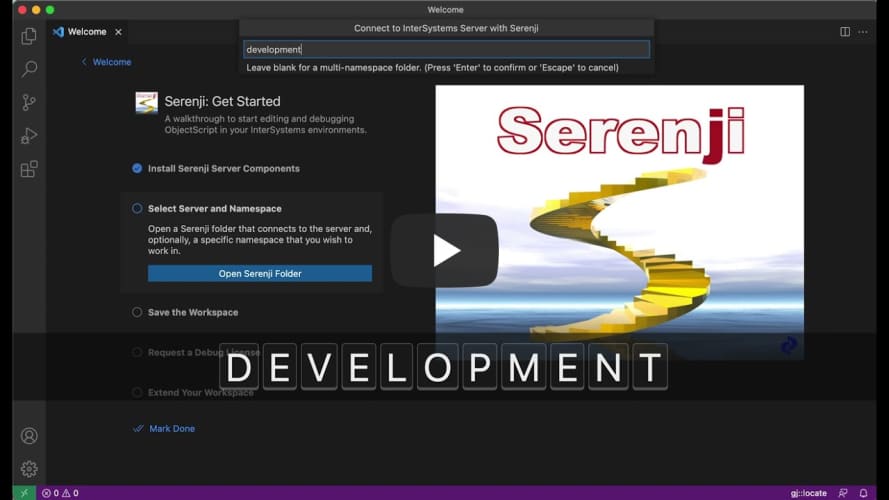
In this video, you will learn how to use VS Code with Python:

Using VS Code with Python

https://www.youtube.com/embed/PipmxjiMqfM
[This is an embedded link, but you cannot view embedded content directly on the site because you have declined the cookies necessary to access it. To view embedded content, you would need to accept all cookies in your Cookies Settings]

2 0
0 365

Hi developers, 

Serenji 3.2.0, the latest version from George James Software, was released last week and our current users have been enjoying trying out the new features (which you can find more about here). 

If you're thinking about trying Serenji for the first time, we've made it easier to get set up by adding a walkthrough on the VS Code Welcome page. It takes you through: 

  • Setting up the server components.
  • Selecting a server namespace.
  • Saving and extending your workspace.
  • Requesting a debug license (don't forget we offer a free 30 day trial!) 

We've also added prompts and guidance throughout VS Code to open and add Serenji folders to your workspace and when going to run and debug code. 

This is just one of the ways we've enhanced the Serenji debugger to make straightforward and easy to use - so all you need to do is focus on your code. 

Serenji 3.2.0 Welcome Page Walkthrough

1 0
0 215
Question
· Feb 7, 2024
Error debug from VS

Hi community.

Yes, I know that there is other question "VS Code - debugging doesn't work" that is the same issue, but my IRIS instance is not using IIS.

Some times ago, I could debug without problems, but after some updates of Visual Studio, I get the following error

Failed to start the debug session. Check that the Intersystems server's web server supports WebSockets

1 3
0 212

The latest release of Serenji focuses on the debug experience. Not only can you now debug on the spot, no matter where you are or what you're doing, but we've also added some smaller features that will make debugging more straightforward. 

  • Run and Debug CodeLenses - clickable links above each class method, procedure, subroutine or extrinsic function.
  • Intuitive prompting for entrypoints and arguments - when debugging a class method, produce, subroutine or extrinsic function. 
  • Shaded read-only background - to clearly differentiate between documents which are editable and those that are read-only. 
  • Program output in debug console - output is shown in the debug console. 
  • Serenji commands on Server Manager's namespace trees - allowing you to launch Serenji through Server Manager. 

Find out more in our release notes here

1 0
1 265

Hi all,

For custormer support reasons we would like to know if its possible to activate some kind of flag or see/redirect wich is the code (lines) being executed when some misterious problems appear.

Is there any way to view the stack of execution code on a deployed code environment? Is there any other equivalent way to track the execution stack for a certain period of time?

Best regards

1 5
0 450

OAuth server to be deployed on the IRIS learning cloud platform. Clients - one on the other instance of the learning IRIS server, the other client locally on my computer in the container docker.

Both clients get a seemingly correct link (through ##class(%SYS.OAuth2.Authorization).GetAuthorizationCodeEndpoint()) to the login request form:

1 3
1 974

Hi

How do I view the .int code of a compiled class in VS Code?

I am trying to use gj::Locate and the setup works, the explanation is all fine but when i paste an error from the Error Logs into the gj::locate it firstly tells me that it can't find the .cls and when I paste in the .int reference in the text box where you can specify the class, method, line+offset it replies that it can't find the item.

This is something to do with the objectscript extension rather than gj::locate

Nigel

1 5
0 731

Hi I'm hoping the community will once more help me out with a question!

Right I have a production that takes an attachment from an email and processes it, sending out a hl7 message at the end. This works ok.

Now I just need to take the email and send it back out to a 'backup' email address, basically giving
a) A backup incase there is a problem with the email or something else further down the line.
b) A log of the emails receieved.

So I thought the best thing to do is have an operation with an email adapter and to send that my message.

0 6
0 848

SET ^||fruit(1)="apple",^||fruit(4)="banana",^||fruit(8)="cherry"
SET ^||fruit(1,1)="Macintosh",^||fruit(1,2)="Delicious",^||fruit(1,3)="Granny Smith"
SET ^||fruit(1,2,1)="Red Delicious",^||fruit(1,2,2)="Golden Delicious"
SET ^||fruit="Fruits"
ZWRITE ^||fruit

^||fruit="Fruits"
^||fruit(1)="apple"
^||fruit(1,1)="Macintosh"
^||fruit(1,2)="Delicious"
^||fruit(1,2,1)="Red Delicious"
^||fruit(1,2,2)="Golden Delicious"
^||fruit(1,3)="Granny Smith"
^||fruit(4)="banana"
^||fruit(8)="cherry"

0 4
0 712

I am attempting to follow the tutorial at Publishing Web Services Using Caché | Caché Web Services QuickStart Tutorial | Caché & Ensemble 2018.1.4 – 2018.1.11 to build a toy SOAP web-service using Cache but am running into what I suspect are permissions issues, or perhaps setting up the "plumbing" to get an incoming request to call the web-service methods.

0 1
0 22

Our development server is set up to automatically keep the .INT code of compiled classes and routines, but the live servers are set to not keep the .INT code.

I know how to set the system to keep this code ($SYSTEM.OBJ.SetQualifiers() ?) but what are the ramifications of keeping this code on the live servers? Is it just a space issue? I always thought it was to keep the code more private.

0 4
0 629

I am experiencing a problem with an EDI process that uses a SQL Batch Service to connect to our DEV environment. However, when we point the EDI service to our TEST server, it errors out.

I have checked every single property on our TEST and DEV servers as well as the properties on the associated tables. They are identical. Nothing has changed in the SQL either.

0 1
0 337

Hi i have rules and i want to log them to analyse what rules executed , I want to add in the log Msg Controller Id, MRN, Value coming in the message, and my customize text telling whats wrong with this field... i have like 50 rules and at the end i can check the log table and found like 20 entries so it means 20 data issues are there for a given message control id. any advice how to to do it

0 3
0 289

While I love using VSCode for IRIS development work, one of the persistent frustrations with it has been the inability to display an object hierarch in the variables window while debugging. Only the object's reference identifier is displayed. Cache Studio's handling of the same issue is a little clunky, but it does at least have the option to display something as an object.

For now, I make do with a combination of the watch window and the command line in the debugging console -- but this feels just a step away from log.debug()/console.log() level debugging sometimes.

0 2
0 596

Hello,

Last weekend we've updated our Caché version to

Versie:Cache for Windows (x86-64) 2018.1.1 (Build 312U)

I'm using Studio to develop. I've been using the built-in debugger and it has been working nicely. But now, since the upgrade, I'm getting this error when trying to debug any routine or class method:

0 11
0 1K