Every developer has made the mistake of accidentally leaving temporary debug code in place when they meant to remove it after debugging is complete. The great thing about writing in ObjectScript is that there is a way to make temporary code be truly temporary and automatically self-destruct! This can also be done in such a way that the code has no change of making it into your source control stream, which can be helpful as well.

3 1
0 369

In time for InterSystems Global Summit 2019 we at George James Software are pleased to offer a cloud-hosted evaluation environment where you can work with Serenji in Visual Studio Code, editing and debugging ObjectScript in a sandbox running InterSystems IRIS 2019.3 Community edition.

You can do it all from your web browser. Nothing will be installed on your workstation, nor will any settings have to be changed on it.

To take Serenji for a test drive please visit https://georgejames.com/dc-gitpod

2 2
1 311

Hi Everyone,

New Coding Talk, recorded by @Evgeny Shvarov, is already on InterSystems Developers YouTube:

GitHub Repository Template To Develop and Debug ObjectScript in InterSystems IRIS

https://www.youtube.com/embed/PumOI3q5Gdk
[This is an embedded link, but you cannot view embedded content directly on the site because you have declined the cookies necessary to access it. To view embedded content, you would need to accept all cookies in your Cookies Settings]

9 13
3 508

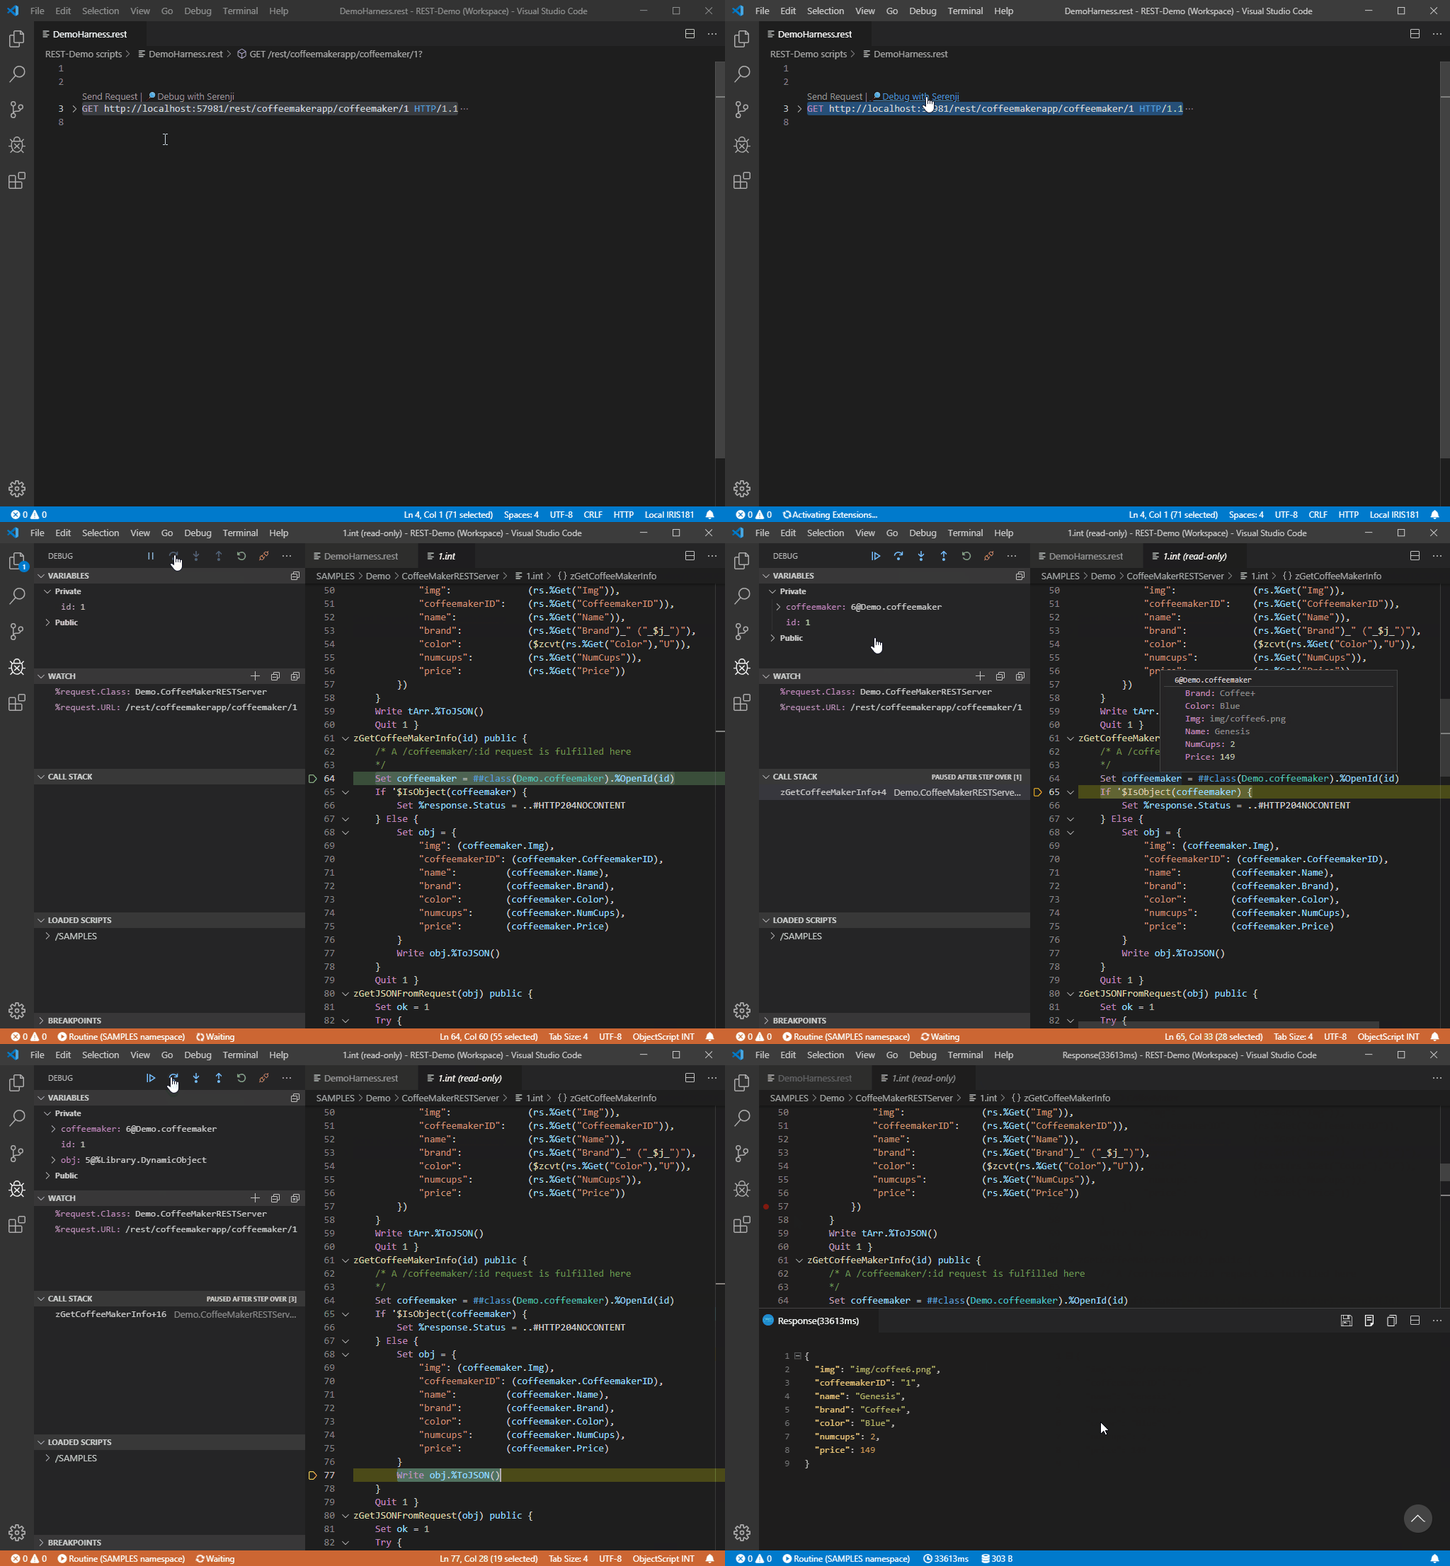
We've just published an update to the Serenji extension for VS Code. Starting with this version (3.0.7) you can now debug the code that implements your REST services. Here's a taster:

Read more about Serenji on Open Exchange.

4 0
2 433

OAuth server to be deployed on the IRIS learning cloud platform. Clients - one on the other instance of the learning IRIS server, the other client locally on my computer in the container docker.

Both clients get a seemingly correct link (through ##class(%SYS.OAuth2.Authorization).GetAuthorizationCodeEndpoint()) to the login request form:

1 3
1 763

I am fairly new to Cache and ObjectScript. I have a new task I have created with a corresponding method that I am trying to debug in Studio (2013).

My ClassMethod looks like this

ClassMethod DoMyWork(Output pWorkCount as %Integer,  pInput1 As %Integer = 30)

{

/* Does some work here and increments pWorkCount */

}

When I try to debug this using studio, I browse to my method but I am not certain what to put in here for the input parameter 'pWorkCount'.

0 3
0 632

This is more for my memory that anything else but I thought I'd share it because it often comes up in comments, but is not in the InterSystems documentation.

There is a wonderful utility called ^REDEBUG that increases the level of logging going into mgr\cconsole.log.

You activate it by

a) start terminal/login

b) zn "%SYS"

c) do ^REDEBUG

6 0
0 1.1K

The %Net.SSH.Session class lets you connect to servers using SSH. It's most commonly used with SFTP, especially in the FTP inbound and outbound adaptors.

In this article, I'm going to give a quick example of how to connect to an SSH server using the class, describe your options for authenticating, and how to debug when things go wrong.

Here's an example of making the connection:

10 3
0 5.5K

We at George James Software are pleased to announce that our acclaimed code debugger and editor Serenji is now available as a Visual Studio Code extension.

As well as supporting the latest InterSystems IRIS platform Serenji also works with earlier platforms, including versions lacking the server-side Atelier API support required by other VS Code extensions.

Serenji connects you directly to the code in your namespaces, resulting in an experience more familiar to existing Studio users. No need to export and import classes and routines.

We believe Serenji is the first extension to bring VS Code's powerful debugging features to ObjectScript developers.

5 13
3 1.2K

Hello,

Last weekend we've updated our Caché version to

Versie:Cache for Windows (x86-64) 2018.1.1 (Build 312U)

I'm using Studio to develop. I've been using the built-in debugger and it has been working nicely. But now, since the upgrade, I'm getting this error when trying to debug any routine or class method:

0 11
0 894

Our development server is set up to automatically keep the .INT code of compiled classes and routines, but the live servers are set to not keep the .INT code.

I know how to set the system to keep this code ($SYSTEM.OBJ.SetQualifiers() ?) but what are the ramifications of keeping this code on the live servers? Is it just a space issue? I always thought it was to keep the code more private.

0 4
0 530

At the George James Software booth at Global Summit last year we took the wraps off the work we've been doing to make our popular editing and debugging tool Serenji available on the Visual Studio Code platform.

Rather than requiring you to pull code from your namespaces into local files, then push the changes back to the namespace to run it, you work directly in the namespace. In other words, the editing experience is like Studio rather than like Atelier.

As well as editing code you can also debug it directly from VSCode.

3 12
1 785

I've been looking at the idea of developing a Time Travel Debugger utility.

It would take a debug target and have a few options such as stack depth and disclude system code.

The debugger would either be started from an external tool, or triggered from a line of code inserted into a method that I want to record.

The debugger would execute the code from start to end and record the full stack on each step to the configured depth.

0 4
0 369
Question
· Oct 10, 2018
WebTerminal : blank screen

I just downloaded and installed the latest WebTerminal into my local copy of Healthshare 2016.2.1

I installed via studio and everything compiled without error.

However when I run it I just see a black screen. The help window at the bottom of the screen pops open when I type '/' but I just can't get any response.

Any suggestions as to how to trouble shoot this?

Mike

0 11
0 498

Using our cool new debugging extension for Visual Studio Code I'm trying to debug a CreateProjection method of a class, but when I compile it the work apparently gets done in one of the worker jobs, so my breakpoint never triggers.

Is there a compiler flag or qualifier to force the compilation to be done in-process rather than getting handed off to a worker job?

2 4
0 440
Article
· Oct 1, 2018 4m read
Profiling code using Caché Monitor

Not everyone knows that InterSystems Caché has a built-in tool for code profiling called Caché Monitor.

Its main purpose (obviously) is the collection of statistics for programs running in Caché. It can provide statistics by program, as well as detailed Line-by-Line statistics for each program.

Using Caché Monitor

Let’s take a look at a potential use case for Caché Monitor and its key features. So, in order to start the profiler, you need to go to the terminal and switch to the namespace that you want to monitor, then launch the %SYS.MONLBL system routine:

3 1
7 924

If you are attending Global Summit 2018 please be sure to say hello to George James Software in the Partner Pavilion.

You are also invited to the informal lunchtime meeting we're hosting at Global Summit on Tuesday 2nd October from 1pm in Indian Paintbrush, a meeting room at the conference venue. We will be previewing the next versions of Deltanji, our integrated source code management solution, and Serenji, our editor and debugger.

10 0
0 343

Hi Community,

I would like to share with you my experience regarding to debugging via Atelier.

I'm developing a REST API and would like to attach to a process when I call the API via a REST Client tool, for example Postman. The purpose is to inspect values from HEADER and BODY of the HTTP request during the debugging process.

Come on! How am I doing? I am going to demonstrate that by using a class from SAMPLES namespace.

1 - Open Atelier;

2 - Open your REST Service class;

3 - Go to the method related to the URI that you need to debug;

9 3
0 1.2K

One of the most important features during application development is the ability to debug your code easily. Because of the asynchrnous nature, a standard Node.js application server works single-threaded by default. When you are developing applications using an IDE like Visual Studio Code, you can very easily debug your Node.js process:

First, download the free Visual Studio Code IDE (@code) and install it on your development machine.

3 0
0 2K

We have a large number of processes and operations being applied to outbound HL7 messages from our PAS.

If I select a message, and open its visual trace, I see the service, as well as all processes, and operations.

My debugging is often about a new operation, and I don't need to see all the other operations that are in functioning as desired.

0 2
0 362

Hi world, i work actually on an intersystems project , my question is :

i've my Rest class that receive an HTTP request from a client side , i want to know how extract data from this http request , for example : date , id_client and measures taken by the client ( i need to extract a weight value catched from a connected scale to my smart phone via bluetooth ) .

Thank you

0 4
0 389