This post is meant to provide a quick possible explanation for a very perplexing problem.

Scenario: You’ve just created your own administrative user in your 2014.1 (or later) instance of Caché. You gave it every possible security role (including %All), so it should in theory be able to do anything within the instance.

You’ve written a very advanced routine with a break command in it for debugging:

7 1
0 523

Hi I am trying to run a debugger in VS Code. I have the settings.json file and the launch.json file. I am trying to debug code using the attach to a process method, however when I run the debugger I get the following error.

Launch.json code

{

// Use IntelliSense to learn about possible attributes.

// Hover to view descriptions of existing attributes.

0 1
0 419

We have a custom business service that is triggered by a scheduled task. The service queries a table, iterates over the result set and sends a message on to a business process for each result. Happy path functionality is all fine.

However, when there is an error detected in the business service code, neither throwing an exception nor returning an error %Status behaves as we'd expect.

0 1
0 141
Question
· Jan 25, 2017
Debugging web app

Hello, I'm trying to debug web app in Atelier remotely.

In Studio I could use "Set as debug target" option for this purposes. The class launches with CSPDEBUG option in browser and everything goes fine. But I can't find how to do this in Atelier.

Can anyone help me?

0 1
0 432
Article
· Oct 1, 2018 4m read
Profiling code using Caché Monitor

Not everyone knows that InterSystems Caché has a built-in tool for code profiling called Caché Monitor.

Its main purpose (obviously) is the collection of statistics for programs running in Caché. It can provide statistics by program, as well as detailed Line-by-Line statistics for each program.

Using Caché Monitor

Let’s take a look at a potential use case for Caché Monitor and its key features. So, in order to start the profiler, you need to go to the terminal and switch to the namespace that you want to monitor, then launch the %SYS.MONLBL system routine:

3 1
7 1.1K

Hi,

I'm getting thousands of errors like the ones below:

2021-05-03 14:11:44 [SQLCODE: <-400>:<Ocorreu um erro fatal>] [Cache Error: <<READ>Dispatch+14^%SYS.BINDSRV>] [Location: <ServerLoop>] [Client info: <Username: KIORAS, Node Name: 3IK0VLS5UU, IP Address: 192.168.1.223, Executable Name: EXTRService.exe, Internal Function: B0>] [%protocol: <52>] $Id: //ce/2018.1.2/kernel/common/src/aclass.c#1 $ 23468 104

0 1
0 636

Hi everyone,

I have an existing application on HealthShare 2015 and decide to move it to HealthShare 2018 to make use of Atelier support. I am using Eclipse Photon with Atelier Plugin 1.3.

Most of things are working better on Atelier comparing with Built-in studio of HealthShare. However, when I tried debugging CSP file with Atelier I encounter 2 problems:

1.

0 1
0 374

Every developer has made the mistake of accidentally leaving temporary debug code in place when they meant to remove it after debugging is complete. The great thing about writing in ObjectScript is that there is a way to make temporary code be truly temporary and automatically self-destruct! This can also be done in such a way that the code has no change of making it into your source control stream, which can be helpful as well.

3 1
0 446

Hi developers,

We're excited to let you know about the latest release of Serenji, your on-the-spot debugger from George James Software. Version 3.2.0 focuses on the debug experience and introduces zero configuration for users. No matter where you are or what you're doing, Serenji is always ready to go in just one click, so you won't lose focus by spending time setting up a launch configuration.

This enhanced debugger also takes advantage of the latest features of VS Code itself. With this powerful combination you'll be able to smoothly identify and quickly fix errors in your code, contributing to the production of quality, maintainable code... and isn't that what everyone wants?!

In this latest release you will experience:

  • Debugging in just one click with zero configuration.
  • Navigation directly to the source of an error using our gj :: locate technology.
  • Intuitive prompting for entrypoint and arguments.
  • Configurable break on error.
  • Program output in debug console.
  • Run and Debug CodeLenses.
  • Run multiple concurrent debug sessions and consoles.
  • Shaded background for read-only documents.

If you're a new user, it's now easier for you to get started. The introduction of a welcome page Walkthrough and guidance on the Explorer and Run and Debug views means you can effortlessly create your initial workspace and start debugging.

Download Serenji directly from the VS Code marketplace and take a look at our release notes to find out more about these new features and how to use them.

We offer a free 30 day trial so if you're not yet a user of Serenji but you're interested in how it can help you, drop me a message through the Developer Community or email us at info@georgejames.com.

Happy debugging!

7 1
4 372

When there's a performance issue, whether for all users on the system or a single process, the shortest path to understanding the root cause is usually to understand what the processes in question are spending their time doing. Are they mostly using CPU to dutifully march through their algorithm (for better or worse); or are they mostly reading database blocks from disk; or mostly waiting for something else, like LOCKs, ECP or database block collisions?

15 1
4 482

I am attempting to follow the tutorial at Publishing Web Services Using Caché | Caché Web Services QuickStart Tutorial | Caché & Ensemble 2018.1.4 – 2018.1.11 to build a toy SOAP web-service using Cache but am running into what I suspect are permissions issues, or perhaps setting up the "plumbing" to get an incoming request to call the web-service methods.

0 1
0 16

Hi developers, 

Serenji 3.2.0, the latest version from George James Software, was released last week and our current users have been enjoying trying out the new features (which you can find more about here). 

If you're thinking about trying Serenji for the first time, we've made it easier to get set up by adding a walkthrough on the VS Code Welcome page. It takes you through: 

  • Setting up the server components.
  • Selecting a server namespace.
  • Saving and extending your workspace.
  • Requesting a debug license (don't forget we offer a free 30 day trial!) 

We've also added prompts and guidance throughout VS Code to open and add Serenji folders to your workspace and when going to run and debug code. 

This is just one of the ways we've enhanced the Serenji debugger to make straightforward and easy to use - so all you need to do is focus on your code. 

Serenji 3.2.0 Welcome Page Walkthrough

1 0
0 215

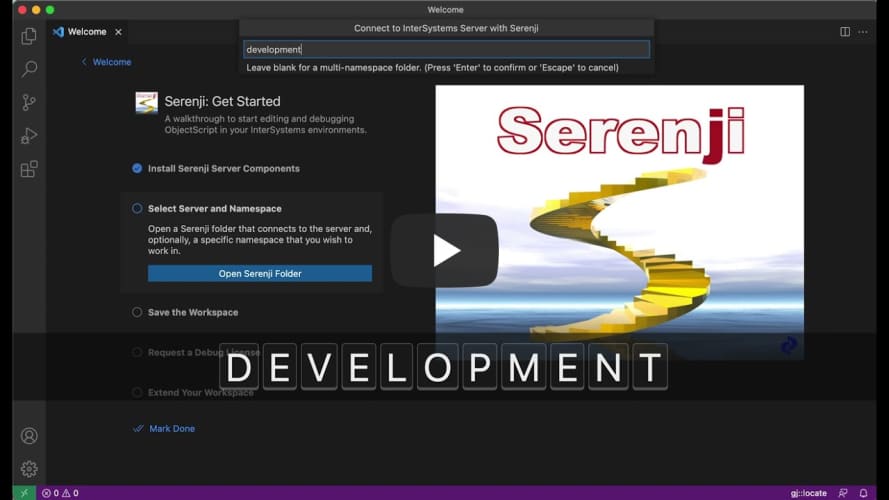
The most recent release of Serenji features our innovative gj::locate technology. It was a standalone tool we originally created for a Developer Community contest earlier this year, but we've incorporated it into our debugger after some great feedback from developers. 

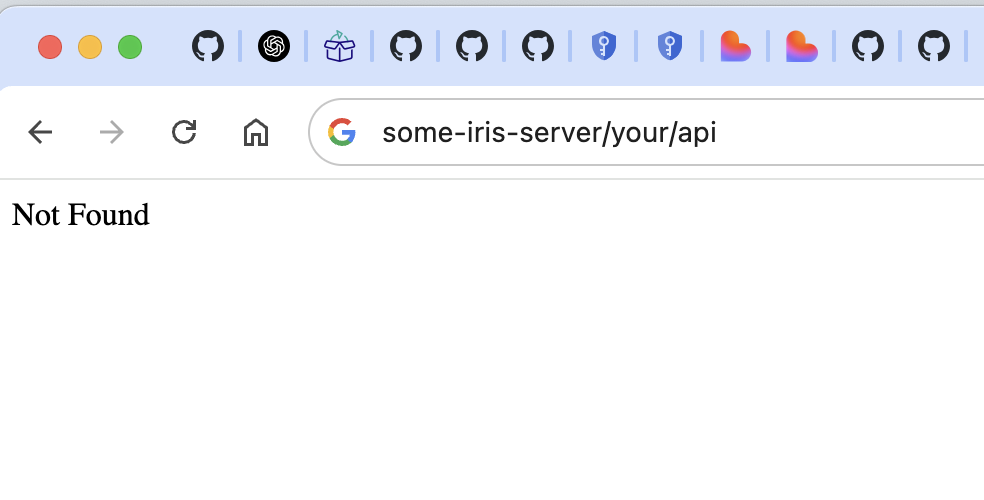
It works by navigating you directly to the source of your server-side errors in just a couple of clicks - enabling you to quickly fix errors without the need to count tedious lines of code... and let's be real, who has got time for that when you're under pressure to fix this bug? 

It's simple and straightforward to use:

1. Click on the gj::locate panel in the status bar

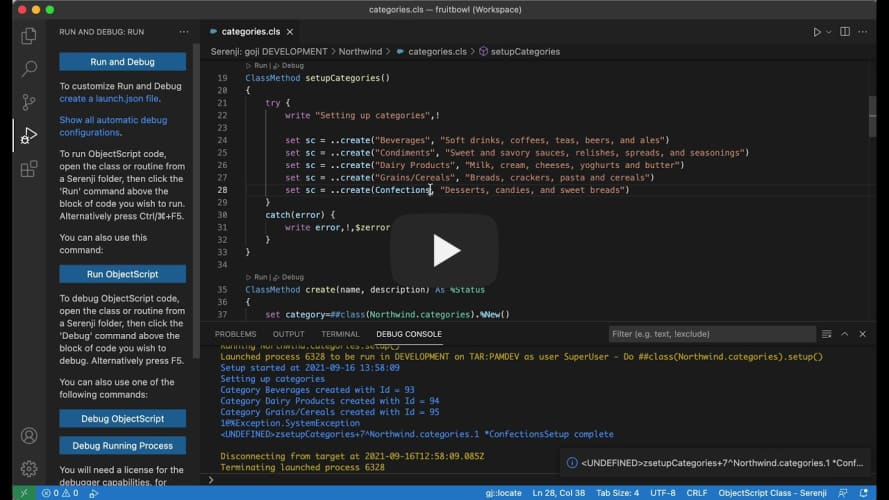
2. Enter the ObjectScript error message or line reference from a class/.mac routine..

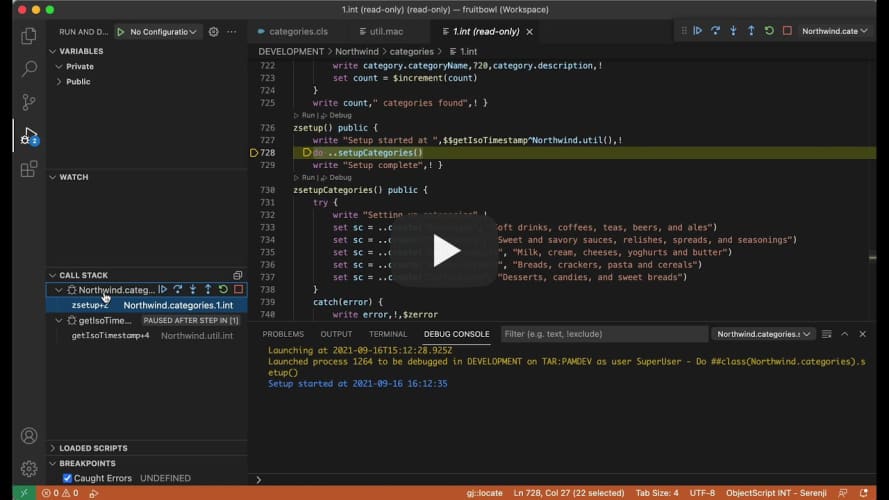
3. gj::locate then does the work for you by taking you straight to the corresponding line in your source code.

Easy peasy... and with time to spare to make yourself a coffee before your deadline! 

The video below shows it in action - let us know if you've already given it a go. Or, if you're interested in trying it out we offer a free 30 day trial license, just drop me a message through the Developer Community or email us at info@georgejames.com.

Serenji 3.2.0 utilising gj::locate technology

2 0
0 213

Hi developers, 

We've incorporated VS Code's support for multiple concurrent debug sessions and consoles into the latest release of Serenji

So if you're working with processes that relate or are dependent on each other, you can now debug them together. Just launch a second Serenji debug session (F5) whilst the first one is still active. 

This short video below shows how it works. We hope you find this feature useful! 

Laurel 

Serenji 3.2 multiple concurrent debug sessions

0 0
0 202

One of the most important features during application development is the ability to debug your code easily. Because of the asynchrnous nature, a standard Node.js application server works single-threaded by default. When you are developing applications using an IDE like Visual Studio Code, you can very easily debug your Node.js process:

First, download the free Visual Studio Code IDE (@code) and install it on your development machine.

3 0
0 2.2K

This is more for my memory that anything else but I thought I'd share it because it often comes up in comments, but is not in the InterSystems documentation.

There is a wonderful utility called ^REDEBUG that increases the level of logging going into mgr\cconsole.log.

You activate it by

a) start terminal/login

b) zn "%SYS"

c) do ^REDEBUG

6 0
1 1.4K

The latest release of Serenji focuses on the debug experience. Not only can you now debug on the spot, no matter where you are or what you're doing, but we've also added some smaller features that will make debugging more straightforward. 

  • Run and Debug CodeLenses - clickable links above each class method, procedure, subroutine or extrinsic function.
  • Intuitive prompting for entrypoints and arguments - when debugging a class method, produce, subroutine or extrinsic function. 
  • Shaded read-only background - to clearly differentiate between documents which are editable and those that are read-only. 
  • Program output in debug console - output is shown in the debug console. 
  • Serenji commands on Server Manager's namespace trees - allowing you to launch Serenji through Server Manager. 

Find out more in our release notes here

1 0
1 264

Come and say hi to us in the Partner Pavilion at the Global Summit!

We’ll be showcasing our Serenji on-the-spot debugger which has undergone some big changes in the last year—users can now enjoy a seamless debugging experience with zero configuration, along with taking advantage of the latest features in VS Code itself, enabling users to smoothly identify and quickly fix errors in your code, contributing to the production of quality, maintainable code.

If you want to see Serenji in action look for us in the Partner Pavilion, we'll be on hand to show you a demo. Prospective users are also welcome to join our User Group Session during the lunchtime session on Wednesday, June 22nd. Email laurelj@georgejames.com to let us know you'll be there.

2 0
0 230

Hi developers,

We're hosting a User Group session for our Deltanji source control and Serenji debugger users on Wednesday, November 3rd at 11-12pm EDT / 3-4pm GMT.

We'll be showcasing some advanced features of Deltanji and Serenji in VS Code with time for a discussion - so feel free to bring along any problems you need help solving or share your feedback on our tools. We'd love to hear your thoughts.

You can find out more on Eventbrite.

Everyone is welcome. If you're interested in our tools this is a great chance to hear what others have to say, as well as asking your own questions.

We hope to see you on November 3rd!

3 0
0 149

Only a few days to go until the Global Summit! George James Software will be on hand to talk about any projects you may have on the horizon, such as application development, data and platform migration, system integration, training, and support – we can work with you to find practical and maintainable solutions that support the growing needs of your organization.

We're also running a User Group Session on Wednesday, July 22nd at 12pm. It's a great opportunity to find out more about our tools and ask us (and current users!) any questions.

3 0
0 185

Hey everyone!

I recently learnt something new while working with WRC on an issue, and I wanted to share with everyone on the off chance it could help someone else.

Scenario:

Files are being inexplicably written to a folder on your server and, due to the number of files in the folder and general system throughput, it is not possible to work through the files to track down the source.

4 0
0 390

We're hosting our Deltanji and Serenji user group session tomorrow - there's still time to register, if you haven't already.

We'll be showcasing some advanced features of Deltanji and Serenji in VS Code with time for a discussion - so feel free to bring along any problems you need help solving or share your feedback on our tools. We'd love to hear your thoughts. If you're interested in our tools this is a great chance to hear what others have to say, as well as asking your own questions.

Date: Wednesday, November 3rd

Time: 11-12pm EDT / 3-4pm GMT.

Let us know you'll be attending on Eventbrite.

We hope to see you tomorrow, but if you're unable to make it you can email me at laurelj@georgejames.com and I can share a recording of the session.

0 0
0 164

If you are attending Global Summit 2018 please be sure to say hello to George James Software in the Partner Pavilion.

You are also invited to the informal lunchtime meeting we're hosting at Global Summit on Tuesday 2nd October from 1pm in Indian Paintbrush, a meeting room at the conference venue. We will be previewing the next versions of Deltanji, our integrated source code management solution, and Serenji, our editor and debugger.

10 0
0 372