#Debugging

5 Followers · 174 Posts

Debugging is the process of finding and resolving defects or problems within a computer program that prevents the correct operation of computer software or a system.

Question Đặng Phú Lộc · May 28, 2020

Hi everyone,

I have an existing application on HealthShare 2015 and decide to move it to HealthShare 2018 to make use of Atelier support. I am using Eclipse Photon with Atelier Plugin 1.3.

Most of things are working better on Atelier comparing with Built-in studio of HealthShare. However, when I tried debugging CSP file with Atelier I encounter 2 problems:

1. 

From a CSP file, I can open the generated *.INT file without any problem. But when I open the generated *.cls file it shows me the error:

1
0 423
Article Evgeny Shvarov · May 25, 2020 2m read

Hi ObjectScript developers!

How to Protect Your Belongings from Pests While Moving - Delicate ...

InterSystems ObjectScript is perhaps the best language on the planet to deal with globals - and it is an interpretable language.

Yes, it has a compiler. But even the compiler can compile some lines in ObjectScript which will then fire as bugs during the runtime.

There are some technics on how to avoid that such as unit testing, coding guidelines and your coding experience, of course ;)

Here I want to present to you the yet another approach to how you can reduce the number of errors in your ObjectScript runtime and enforce coding guidelines - it's an ObjectScript Quality tool developed by Lite Solutions, InterSystems solution partner.

See the details below.

0
0 518
Question Michael Gosselin · May 14, 2020

So, I was doing a debug test on a routine, and tried to open a file (yes, it does exist) as so:

file=##class(%File).%Open($$$airfile,"R")

And, I got the above-mentioned error. It begins with "cn_iptcp://localhost:56775/%Stream.Object.1.INT" in case the port means anything.

This is a single-license version of Cache 2017.2, which I installed about three years ago. You would think I'd have the .INT files, but I don't. Oh, one other oddity: I can't seem to compile the routine, despite having admin privs for the machine. It's Windows 7 64-bit.

Any help is appreciated.

2
0 472
Article Daniel Kutac · May 15, 2020 3m read

Hi, if you develop production with HealthShare, you may have noticed there is a nice tracing feature available - HS.Util.Trace.Operations. This feature allows visually tracing debug information, in structured way. It complements good old logging macros like $$$LOGINFO, $$$TRACE and alike.

I use this feature a lot. However, it has limited functionality, it works nice with classes that extend XML Adapter, streams or data types, but it doesn't work well with arbitrary objects that do no extend from XML Adapter.

2
0 791
Question Akshat Vora · Jan 23, 2020
   try{
        ....
        ....
        ....

        Set tSC = method_invocation()

        If $$$ISERR(tSC) {
            Quit tSC
        }

        ....
        ....
        ....

}

On compiling the above, I get an error saying "QUIT argument not allowed : 'tSC' ".

  • When I replace Quit tSC with Return tSC, it compiles
  • On replacing Quit tSC with Quit $$$OK, I get the error: QUIT argument not allowed : '1'
  • On replacing Quit tSC with Quit, it compiles
  • A 'Quit tSC' statement outside of the try-catch block does not cause a compile-time error.
9
0 1202
Article Peter Steiwer · Dec 12, 2019 2m read

DeepSeeButtons is available on Open Exchange! This tool will generate a diagnostic report of your DeepSee environment.

The report consists of multiple sections. These sections range from System Details to Caché/InterSystems IRIS logs to Cube information. In addition to simply providing information about the environment, some common recommended configurations are checked. If a recommended configuration is not used, an alert is displayed highlighting that the environment configuration does not match the recommended configuration.

1
0 552
Question Matthew Martinez · Dec 2, 2019

Hello,

I am reading in an X12 document into my production that needs to be processed and returned as a CSV file.  I have created a record map to support the fields I want to extract with a batch class to store headers.  I have a DTL mapping the data to the appropriate fields in the record map and am sending the record map to a EnsLib.RecordMap.Operation.BatchFileOperation.

None of my components error out and in fact report that the message was processed without any errors but I am not getting an output file in my expected output folder. 

2
0 1040
Question Matthew Martinez · Dec 2, 2019

Hello,

I have a record map and batch class being passed to an EnsLib.RecordMap.Operation.BatchFileOperation.

They are designated as INFORMATION.FPL.Record and INFORMATION.FPL.Header

After reaching the operation it errors out with this message : ERROR <Ens>ErrGeneral: Quitting with error on Message body 5@INFORMATION.FPL.Record / 54 because Status 'ERROR <EnsRecordMap>ErrNoBatchParent: Record with class 'INFORMATION.FPL.Record' and Id '54' doesn't belong to a batch' matched ReplyCodeAction 1 : 'E=F' resulting in Action code F

Some screen grabs are attached of my configuration.

1
0 641
Question Đặng Phú Lộc · Nov 15, 2019

Hi everyone,

I've encountered this annoying issue so many times before, if any one also encounter this issue, please share here if you have any solution.

So, I've been working on a web service project using HealthShare 2015. Sometimes I have to set a debug target to a csp file to debug it. If I pause the debug process about 3 minutes above or so (to examine an object, variable, etc..) the studio will hang.

4
0 605
Question Tom Van Oosterwyck · Dec 3, 2019

Hello,

I have a couple of IOT devices that communicate via WebSockets to our backend.

I successfully managed to create a websocket connection between server and (iot)client using %CSP.WebSocket
However I would like to implement authentication on this using the HTTP headers at the same time of Connection: Upgrade.

I tried to set the headers to globals in order to debug but they are always empty.

Example code: 

1
0 344
Announcement John Murray · Sep 20, 2019

In time for InterSystems Global Summit 2019 we at George James Software are pleased to offer a cloud-hosted evaluation environment where you can work with Serenji in Visual Studio Code, editing and debugging ObjectScript in a sandbox running InterSystems IRIS 2019.3 Community edition.

You can do it all from your web browser. Nothing will be installed on your workstation, nor will any settings have to be changed on it.

To take Serenji for a test drive please visit https://georgejames.com/dc-gitpod

2
1 410
Question Arto Alatalo · Nov 1, 2019

All of the sudden, Cache Studio's Debug->Run command started to fail with error '6704 Target has exited debugger' (German: Kein Anbinden möglich). What could be a reason of that? Today we installed Cache Web Terminal (https://intersystems-community.github.io/webterminal/
), could it be possible that the terminal somehow hijacked some debugging api end-point?

Cache for UNIX (Red Hat Enterprise Linux for x86-64) 2017.2.2

Update: any idea what error 6704 means exactly? Studio was able to launch debugging job but it unexpectedly exited? German text seems is trying to say "Can't connect"

5
0 543
Question Ting Wang · Oct 8, 2019

Hi,

I got the <INVALID OREF> error in the component and the error screenshot as follows:

​​​​​​

When I try to debug in the code, I go to the class and view other code in eclipse and find out the error method. How should I determine which line threw the error according to the error? There is the line number"+8" in zProcessRequest method. Is that the line counted from the method name or below? Looking forward to your reply. Thanks.

4
0 1416
Article Ben Spead · Sep 30, 2019 2m read

Every developer has made the mistake of accidentally leaving temporary debug code in place when they meant to remove it after debugging is complete.  The great thing about writing in ObjectScript is that there is a way to make temporary code be truly temporary and automatically self-destruct!   This can also be done in such a way that the code has no change of making it into your source control stream, which can be helpful as well.

1
0 493
Announcement John Murray · Sep 6, 2019

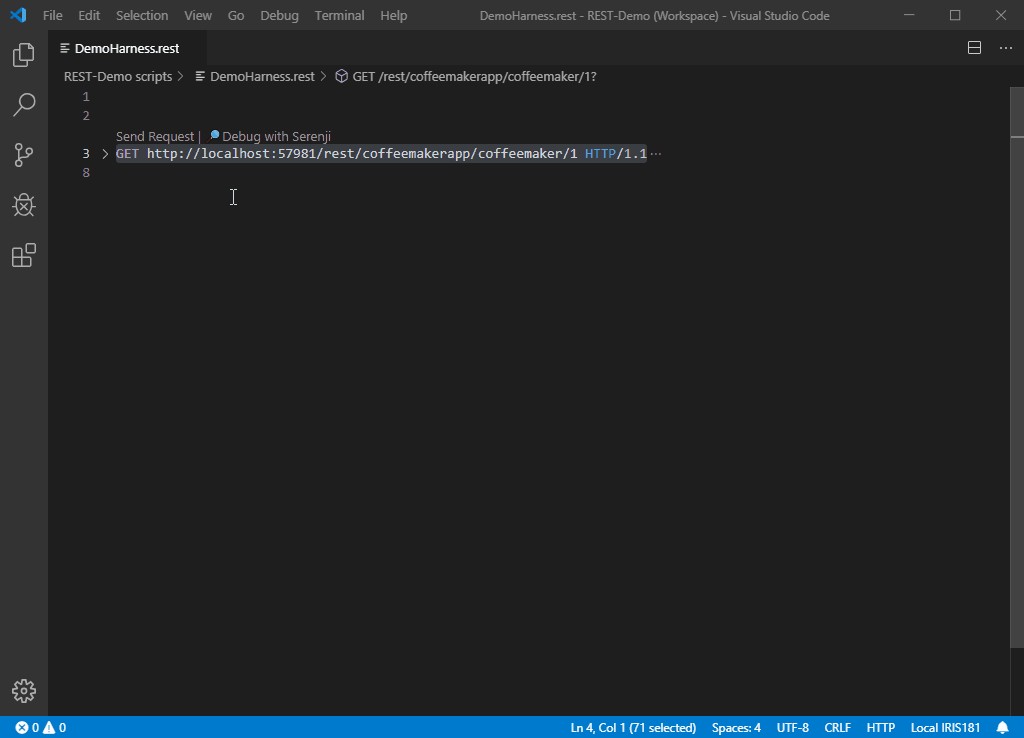
We've just published an update to the Serenji extension for VS Code. Starting with this version (3.0.7) you can now debug the code that implements your REST services. Here's a taster:

Read more about Serenji on Open Exchange.

0
2 554
Question Dmitrii Kuznetsov · Sep 1, 2019

OAuth server to be deployed on the IRIS learning cloud platform. Clients - one on the other instance of the learning IRIS server, the other client locally on my computer in the container docker.

Both clients get a seemingly correct link (through ##class(%SYS.OAuth2.Authorization).GetAuthorizationCodeEndpoint()) to the login request form:  

3
1 1064
Question Daniel Lee · Jul 16, 2019

I am fairly new to Cache and ObjectScript. I have a new task I have created with a corresponding method that I am trying to debug in Studio (2013). 

My ClassMethod looks like this

ClassMethod DoMyWork(Output pWorkCount as %Integer,  pInput1 As %Integer = 30)

{

/* Does some work here and increments pWorkCount */

}

When I try to debug this using studio, I  browse to my method but I am not certain what to put in here for the input parameter 'pWorkCount'.

I tried to execute the class in the terminal window but I am not sure how to enter debug mode using the terminal window. 

Thanks.

3
0 931
Announcement John Murray · Apr 1, 2019

We at George James Software are pleased to announce that our acclaimed code debugger and editorSerenji is now available as a Visual Studio Code extension.

As well as supporting the latest InterSystems IRIS platform Serenji also works with earlier platforms, including versions lacking the server-side Atelier API support required by other VS Code extensions.

Serenji connects you directly to the code in your namespaces, resulting in an experience more familiar to existing Studio users. No need to export and import classes and routines.

We believe Serenji is the first extension to bring VS Code's powerful debugging features to ObjectScript developers.

13
3 1430
Article Stephen De Gabrielle · Jun 26, 2019 1m read

This is more for my memory that anything else but I thought I'd share it because it often comes up in comments, but is not in the InterSystems documentation. 

There is a wonderful utility called ^REDEBUG that increases the level of logging going into mgr\cconsole.log. 

You activate it by

a) start terminal/login

b) zn "%SYS"

c) do ^REDEBUG

d) change logging level to FFFFFFFF

0
1 1532
Question Rueben Van Mol · Mar 14, 2019

Hello,

Last weekend we've updated our Caché version to 

Versie: Cache for Windows (x86-64) 2018.1.1 (Build 312U) 

I'm using Studio to develop. I've been using the built-in debugger and it has been working nicely. But now, since the upgrade, I'm getting this error when trying to debug any routine or class method:

Executing ##class(Blue.App.Handler.Adsolut).TestConnection()
<COMMAND>zDebugStub+30^%Debugger.System.1

This is the code for the classmethod I got the error on;

Class Blue.App.Handler.Adsolut Extends %RegisteredObject
{
ClassMethod TestConnection()
{
  w "ok"
  q
}
}

11
0 1099
Question Laura Cavanaugh · Feb 5, 2019

Our development server is set up to automatically keep the .INT code of compiled classes and routines, but the live servers are set to not keep the .INT code.

I know how to set the system to keep this code ($SYSTEM.OBJ.SetQualifiers() ?)  but what are the ramifications of keeping this code on the live servers?  Is it just a space issue?  I always thought it was to keep the code more private.

4
0 711
Announcement John Murray · Jan 14, 2019

At the George James Software booth at Global Summit last year we took the wraps off the work we've been doing to make our popular editing and debugging tool Serenji available on the Visual Studio Code platform.

Rather than requiring you to pull code from your namespaces into local files, then push the changes back to the namespace to run it, you work directly in the namespace. In other words, the editing experience is like Studio rather than like Atelier.

As well as editing code you can also debug it directly from VSCode.

12
1 907
Question Sean Connelly · Dec 20, 2018

I've been looking at the idea of developing a Time Travel Debugger utility.

It would take a debug target and have a few options such as stack depth and disclude system code.

The debugger would either be started from an external tool, or triggered from a line of code inserted into a method that I want to record.

The debugger would execute the code from start to end and record the full stack on each step to the configured depth.

A visualisation tool would provide a set of controls to play the recording forwards and backwards and provide various ways to search and jump to points in the recording.

4
0 538
Article Sergei Sarkisian · Oct 1, 2018 4m read

Not everyone knows that InterSystems Caché has a built-in tool for code profiling called Caché Monitor.

Its main purpose (obviously) is the collection of statistics for programs running in Caché. It can provide statistics by program, as well as detailed Line-by-Line statistics for each program.

Using Caché Monitor

Let’s take a look at a potential use case for Caché Monitor and its key features. So, in order to start the profiler, you need to go to the terminal and switch to the namespace that you want to monitor, then launch the %SYS.MONLBL system routine:

zn "<namespace>"
do ^%SYS.MONLBL
1
7 1151
Question Mike Dawson · Oct 10, 2018

I just downloaded and installed the latest WebTerminal into my local copy of Healthshare 2016.2.1

I installed via studio and everything compiled without error.

However when I run it I just see a black screen. The help window at the bottom of the screen pops open when I type '/' but I just can't get any response.

Any suggestions as to how to trouble shoot this?

Mike

11
0 701