A few months ago, I read this interesting article from MIT Technology Review, explaing how COVID-19 pandemic are issuing challenges to IT teams worldwide regarding their machine learning (ML) systems.

Such article inspire me to think about how to deal with performance issues after a ML model was deployed.

2 2
0 481

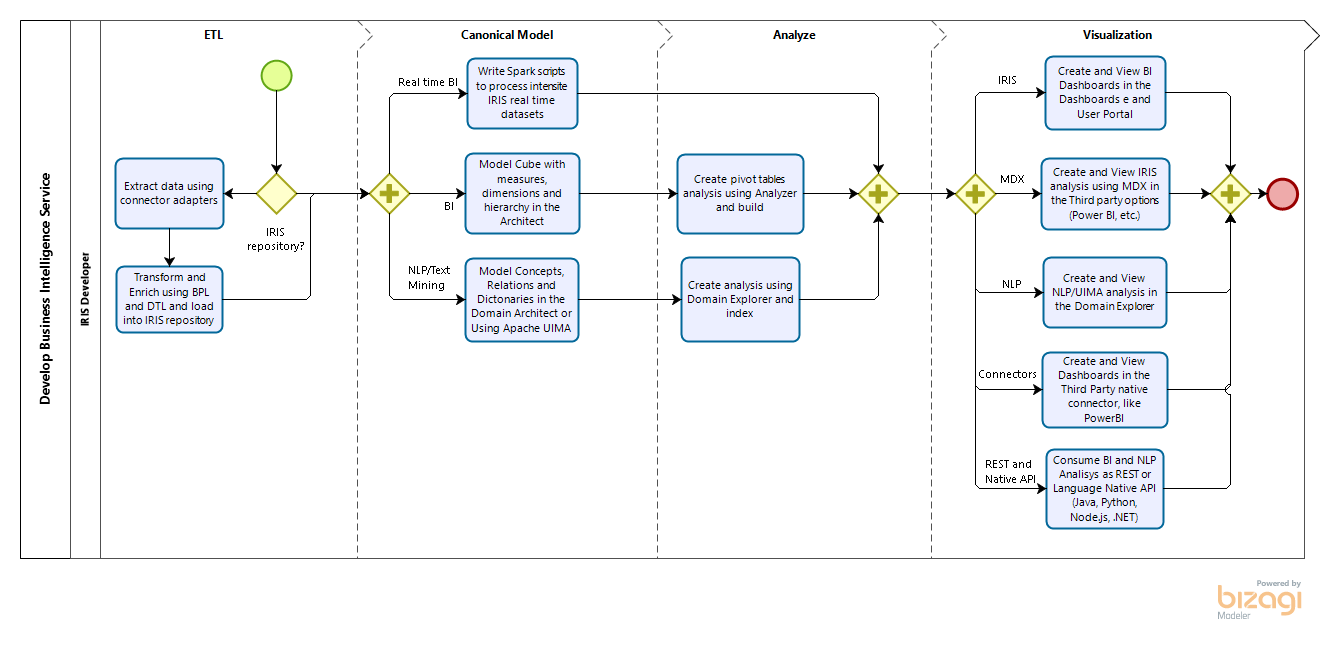
This is my introduction to a series of posts explaining how to create an end-to-end Machine Learning system.

Starting with one problem

Our IRIS Development Community has several posts without tags or wrong tagged. As the posts keep growing the organization
of each tag and the experience of any community member browsing the subjects tends to decrease.

First solutions in mind

We can think some usual solutions for this scenario, like:

5 11
2 531

Now available on Open Exchange is a library of third party charts available to use within DeepSee/InterSystems IRIS BI dashboards. To start, simply download and install, select the new portlet as the widget type, then select the chart type that you desire. If you don't find the type of chart you are looking for, you can easily extend the portlet to implement your desired chart type. These new chart types can be used within existing dashboards or you can create new dashboards using them.

4 0
0 1.1K

Keywords: PyODBC, unixODBC, IRIS, IntegratedML, Jupyter Notebook, Python 3

Purpose

A few months ago I touched on a brief note on "Python JDBC connection into IRIS", and since then I referred to it more frequently than my own scratchpad hidden deep in my PC. Hence, here comes up another 5-minute note on how to make "Python ODBC connection into IRIS".

1 0
1 2.1K

Making a Chart using Intersystems IRIS + Python

How to use the IRIS Native API in Python to access globals and plot some charts.

Why Python?

With a large adoption and use in the world, Python have a great community and a lot of accelerators | libraries to deploy any kind of application.
If you are curious (https://www.python.org/about/apps/)

4 1
0 470

Hi colleagues!

Every day Johns Hopkins University publishes new data on coronavirus COVID-19 pandemic status.

I built a simple InterSystems IRIS Analytics dashboard using InterSystems IRIS Community Edition in docker deployed on GCP Kubernetes which shows key measures of the disease outbreak.

This dashboard is an example of how information from CSV could be analyzed with IRIS Analytics and deployed to GCP Kubernetes in a form of InterSystems IRIS Community Edition.

Added the interactive map of the USA:

19 13
3 1K

InterSystems IRIS Business Intelligence allows you to keep your cubes up to date in multiple ways. This article will cover building vs synchronizing. There are also ways to manually keep cubes up to date, but these are very special cases and almost always cubes are kept current by building or synchronizing.

2 1
0 657
Article
· Mar 2, 2020 2m read
SQL -99 error while viewing a listing

This error is sometimes seen while viewing a listing in InterSystems IRIS Business Intelligence:
ERROR #5540: SQLCODE: -99 Message: User <USERNAME> is not privileged for the operation (4)

As the error suggests, this is due to a permission error. To figure out which permissions are missing/needed, we can take a look at the SQL query that is generated. We will use a query from SAMPLES as an example.

1 0
0 1.1K

Preview Mode was added to InterSystems IRIS Business Intelligence to give designers a quick view of what their resulting Pivot Table will look like without needing to wait for the results to fully execute. This can be beneficial when designing pivot tables because if you are dragging and dropping elements to see how they look/work in your pivot table and seeing if they have the desired data. Since you are exploring and designing, you don't necessarily care about the results at the moment, but you would still like to see how your table looks with the changes you have made.

2 0
0 393

Hello Community,

Thank you all for your continued feedback and support of our ad hoc reporting platform, VDM. There's been some questions around setting up a non-ODBC connection for InterSystems platforms. We published a new YouTube video showing the steps necessary to connect to InterSystems Caché and InterSystems IRIS with BridgeWorks VDM.

2 0
3 260

Over the last couple of weeks the Solution Architecture team has been working to finish off our 2019 workload: this included open-sourcing the Readmission Demo that was brought to HIMSS last year, so we could make it available to anyone looking for an interactive-way of exploring the tooling provided by IRIS.

11 2
1 1.4K

In the previous part of this series, we saw how to include data in a portlet from within DeepSee. This used the built in data controller. In this part, we are going to be pulling in data from outside of DeepSee. This will include both information from within InterSystems IRIS and from the OS.

Why use this?

This is useful if you would like to create a dashboard that only contains information about your system. It is also useful if you want to display data about your system along side data that you have stored in DeepSee.

2 0
0 357

When using Related Cubes in InterSystems IRIS BI, cubes must be built in the proper order. The One side must be built before the Many side. This is because during build time for the Many side, it looks up the record on the One side and creates a link. If the referenced record is not found on the One side, a Missing Relationship build error is generated. The One side is going to be the independent side of the relationship, AKA the side of the relationship that is referenced by the Many side or the Dependent cube. For example: Patients contain a reference to their Doctor.

3 0
0 548

What is %SQLRESTRICT

%SQLRESTRICT is a special %FILTER clause for use in MDX queries in InterSystems IRIS Business Intelligence. Since this function begins with %, it means this is a special MDX extension created by InterSystems. It allows users to insert an SQL statement that will be used to restrict the returned records in the MDX Result Set. This SQL statement must return a set of Source Record IDs to limit the results by. Please see the documentation for more information.

Why is this useful?

This is useful because there are often times users want to restrict the results in their MDX Result Set based on information that is not in their cubes. It may be the case that this information may not make sense to be in the cube. Other times this can be useful when there is a large set of values you want to restrict. As mentioned before, this is not a standard MDX function, it was created by InterSystems to handle cases were queries were not performing well or cases that were not easily solved by existing functions.

6 0
2 683
Article
· Dec 31, 2019 3m read
Portlets that use data from DeepSee


In the previous part of this series, we saw how to reference a web page that will enhance our dashboard experience. Now we will look into referencing data that is already in our cubes.

In this example, we will be referencing the controller object and we will be extracting data from it. This data will then be displayed as text in our Dashboard. In Part 5, we will show how to incorporate this data into other charting libraries.

2 0
0 266

In the previous part of this series, we saw how to define a basic portlet. Now we will look into making this portlet reference a web page that will enhance our dashboard experience.

In this example, we will be embedding a Developer Community article along side a couple of widgets displaying information related to the number of views on the Developer Community articles. This example is not hosted on the Community Analytics server, but if it was we could see the view counts going up as we interacted with the page.

Why use this?

In a real case, perhaps you have an embedded page from an external web site showing the current Emergency Room wait times for Hospitals in your area. This portlet can be used along side widgets from your Emergency Room showing how many people are waiting, how many doctors are active, and how many people are being treated. As other Emergency Room wait times grow, you can possibly expect your volume to increase as well. This can help you make decisions on how to allocate resources.

1 0
0 432
Article
· Dec 12, 2019 2m read
Creating Portlets in DeepSee

What is a portlet?

The simple answer is: a custom widget. A portlet can exist by itself on a DeepSee dashboard, it can be used along side standard DeepSee widgets, or along side other portlets. The rendering of the custom widget is completely user defined. This means you can embed a web page, create a form to perform any sort of action needed based on the data on your dashboard, use third party charting libraries, or simply display data from outside of a DeepSee cube.

How to get started

6 1
0 524
Article
· Nov 26, 2019 3m read
Designing valid hierarchies in DeepSee

When designing a hierarchy in DeepSee, a child member must have only one parent member. In the case where a child corresponds to two parents, the results can become unreliable. In the case where two similar members exist, their keys must be changed so that they are unique. We will take a look at two examples to see when this happens and how to prevent it.

5 1
1 858

Why log in to view pivot tables when you can have them delivered directly to your inbox? Are you in need of automated reporting for InterSystems IRIS Business Intelligence? Pivot Subscriptions is your solution: a tool for subscribing to scheduled email reports of pivot tables inside InterSystems IRIS Business Intelligence (previously known as DeepSee).

6 0
1 556

In an ever-changing world, companies must innovate to stay competitive. This ensures that they’ll make decisions with agility and safety, aiming for future results with greater accuracy.
Business Intelligence (BI) tools help companies make intelligent decisions instead of relying on trial and error. These intelligent decisions can make the difference between success and failure in the marketplace.
Microsoft Power BI is one of the industry’s leading business intelligence tools. With just a few clicks, Power BI makes it easy for managers and analysts to explore a company’s data. This is important because when data is easy to access and visualize, it’s much more like it’ll be used to make business decisions.


9 9
2 3K

AnalyzeThis is a tool for getting a personalized preview of your own data inside of InterSystems BI. This allows you to get first hand experience with InterSystems BI and understand the power and value it can bring to your organization. In addition to getting a personalized preview of InterSystems BI through an import of a CSV file with your data, Classes and SQL Queries are now supported as Data Sources in v1.1.0!

6 4
0 614

Running predictive models natively in an InterSystems IRIS Business Process has of course always been the goal of our PMML support, but somehow never made it into the kit because there were a few dependencies and choices that needed addressing and answering. Anyhow, thanks to some pushing and code kindly provided by @Amir Samary (Thanks again Amir!), we finally got it wrapped in a GitHub repo for your enjoyment, review and suggestions.

1 2
3 496

Users of analytical applications often need to generate and send out PDF reports comprised of elements of the analytical panel. In the InterSystems stack, this task is solved using the DSW Reports project that is an extension of DeepSeeWeb. In this article, we will explain how to use DSW Reports for generating PDF reports and emailing them.

1 0
1 610

Hi all. We are going to find duplicates in a dataset using Apache Spark Machine Learning algorithms.

Note: I have done the following on Ubuntu 18.04, Python 3.6.5, Zeppelin 0.8.0, Spark 2.1.1

Introduction

In previous articles we have done the following:

0 0
1 727

The source class of a DeepSee cube has a property referencing a different class:

Class ClassA Extends %Persistent {
     Property P1 As ClassB;
}

When records in class B change, the ^OBJ.DSTIME global for Class A will not be automatically updated. This means that synchronization of cubes based on source class A will not reflect the changes occurred to property P1.
This post will help you determine the best way to achieve synchronization of properties referencing a different class

4 2
2 511