Previously I have already tried to play with Google Data Studio when I connected it to InterSystems FHIRaaS. It has quite a nice UI, with a few chart types available out of the box, it can be quite easily connected to some plain tables (stored as CSV or JSON, for instance), and gives the ability to build quite flexible analytics over it. So, I have decided to implement a new connector to InterSystems Analytics (DeepSee), with the ability to select a cube and do some queries on it.

3 0
0 301

The OKR methodology (Objectives and Key Results or Objectives and Key Results) is used by the largest companies in the world (such as Google, Netflix, Spotify, BMW, Linkedin, etc.) for agile performance management. It was created in the 1970s by Andrew Grove, president of Intel, and introduced to the general public in his famous book “High Output Management”.

Around 1998 John Doerr, one of the world's top venture capitalists, after coming into contact with Intel's OKR, introduced the model to Larry Page and Sergey Brin, who started a small company called Google.

6 0
1 222
Article
· Aug 13, 2021 4m read
Building Analytics Solution with IRIS

Hi developers!

How to build an analytics solution with InterSystems IRIS?

To begin with, let's agree on the points of what is the analytics solution - and this could be a very wide topic. Let's limit the set of solutions to those you can present in the Analytics contest.

There are three kinds of analytics solutions that we will review here: monitoring, interactive analytics, and reporting.

Monitoring

The typical monitoring solution consists of an online dashboard with KPIs that are being actively updated.

The key use case is of monitoring is to visually observe the KPI of fresh data every moment to react in case of an emergency.

Interactive Analytics

This solution supposes a set of interactive dashboards with filters and drill-downs.

The key use case is to explore the data with filters and drill-downs making business decisions upon graph and table data visualization.

Reporting

Reporting solution provides a set of static (usually) reports in a form of HTML or pdf documents that deliver the data in graph and text form in a predesigned form and could be sent via email.

The typical use case of a reporting system is to obtain reports on a given period that will illustrate the status of the product, process, service, sales, etc that is crucial for the business.

How InterSystems products could be used to build such solutions? Let's discuss this below!

3 0
1 339
Article
· May 11, 2021 8m read
IRIS in Astronomy

In this article we are going to show the results of the comparision between IRIS and Postgress when handling Astronomy data.

Introduction

Since the earliest days of human civilization we have been fascinated by the sky at night. There are so many stars! Everybody has dreamed about them and fantasized about life in other planets.

10 7
0 627

When you have been using cubes for business intelligence in a namespace for some time, you may find that there are many cubes in the namespace, only some of which are actively being used. However, it can be difficult to tell which cubes users are or are not querying, and maintaining unused cubes can be costly both in terms of storage and of computation to keep them up to date. This article provides some suggestions and examples for monitoring which cubes are in active use, and for removing cubes that you determine are no longer necessary.

4 2
2 401

The pandemic that struck the world in 2020 made everyone follow the news and the numbers that involve the COVID-19.

Why don’t you take that opportunity to create something simple and pleasant, to follow the number of vaccinations worldwide?

To face this challenge, I'm using the data provided by Our World in Data - Research and data to make progress against the world’s largest problems.

They have a dedicated repository on Github with the data of COVID-19, and I took the vaccination data to help me with my tracker.

4 4
0 320

Hi guys!

I'd like to present you my new project: iris-analytics-notebook, a notebook approach to use IRIS analytics capabilities.

Project description

In past few years, notebooks tools like Jupyter are gaining popularity due its natural way to express ideias.

An almost unipresent tool for data scientists, notebook can also help to improve the impact of analytics tools for all sort of users.

2 0
0 202

The InterSystems IRIS has a very nice container class to allows you have your Dashboards as classes source code. It is %DeepSee.UserLibrary.Container.

With this class is possible group all your dashboard and pivot table definitions.

This is useful to automatically create your dashboards when you build your docker project and other automation scenarios.

See:

2 4
1 215

Web Crawling is a technique used to extract root and related content (HTML, Videos, Images, etc.) from websites to your local disk. This is allows you apply NLP to analyze the content and get important insights. This article detail how to do web crawling and NLP.

To do web crawling you can choose a tool in Java or Python. In my case I'm using Crawler4J. (https://github.com/yasserg/crawler4j).

1 0
1 736

Today, is important analyze the content into portals and websites to get informed, analyze the concorrents, analyze trends, the richness and scope of content of websites. To do this, you can alocate people to read thousand of pages and spend much money or use a crawler to extract website content and execute NLP on it. You will get all necessary insights to analyze and make precise decisions in a few minutes.

3 3
3 278
Article
· Nov 20, 2020 2m read
Enrich your analytics projects with NLP

According IDC, 80% of all data produced are NoSQL. See:

There are digital documents, scanned documents, online and offline texts, blob content into SQL, images, videos and audio. Imagine a Corporate Analytics initiative without all these data to analyze and support decisions?

In all the world, many projects are using techonologies to transform these NoSQL data into textual content, to allows analyze it. See:

2 0
2 236
Article
· Nov 19, 2020 6m read
OCR and NLP together into InterSystems IRIS

According to IDC, more than 80% of information it is NoSQL, especially text into documents. When the digital services or applications not process all this information, the business lose. To face this challenge, it is possible use OCR technology. OCR uses machine learning and/or trained image patterns to transform image pixels into text. This is important, because many documents are scanned into images inside PDF, or many documents contains images with text inside. So OCR are an important step to get all possible data from a document.

4 3
2 434

Hi guys.

Recently, I get interest in FHIR in order to run for the IRIS for Health FHIR
contest
. As a beginner on this topic, I've heard somewhat about it, but I didn't know how complex and powerful was FHIR. As pointed out by @Henrique Dias here, you can model several aspects of the patient history and other related entities.

4 5
0 292
Article
· Aug 2, 2020 1m read
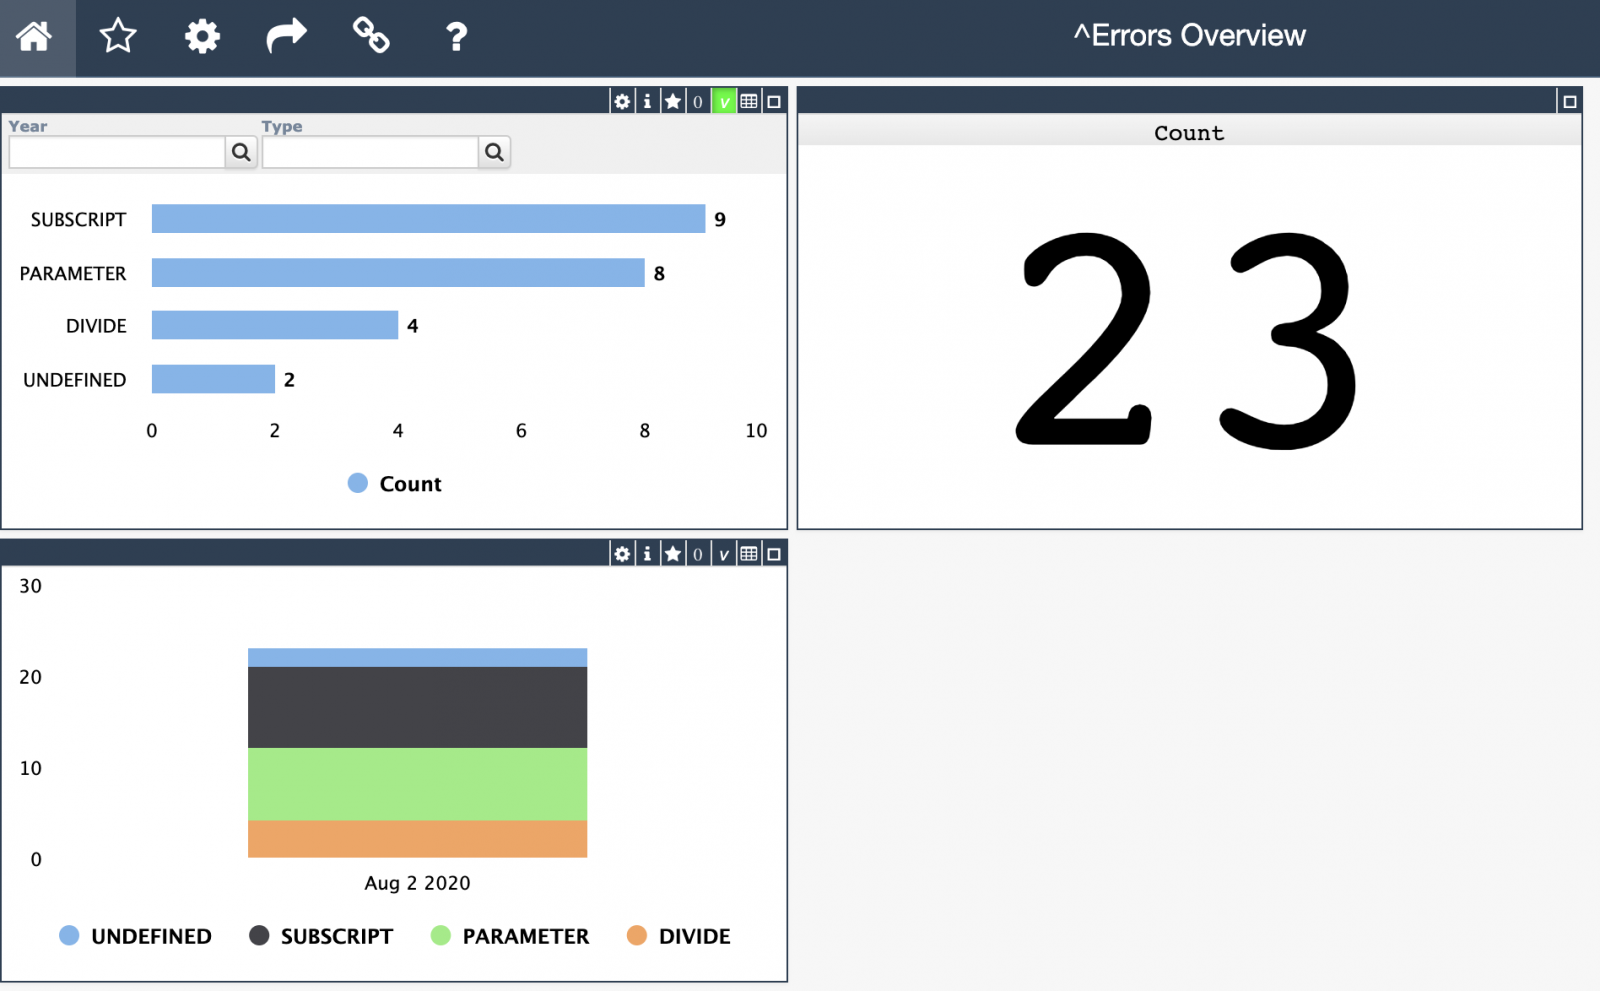
Application Errors Analytics

Hi Developers!

As you know the application errors live in ^ERRORS global. They appear there if you call:

d e.Log() 

in a Catch section of Try-Catch.

With @Robert Cemper's approach, you can now use SQL to examine it.

Inspired by Robert's module I introduced a simple IRIS Analytics module which shows these errors in a dashboard:

3 5
1 295

A few months ago, I read this interesting article from MIT Technology Review, explaing how COVID-19 pandemic are issuing challenges to IT teams worldwide regarding their machine learning (ML) systems.

Such article inspire me to think about how to deal with performance issues after a ML model was deployed.

2 2
0 392

This is my introduction to a series of posts explaining how to create an end-to-end Machine Learning system.

Starting with one problem

Our IRIS Development Community has several posts without tags or wrong tagged. As the posts keep growing the organization
of each tag and the experience of any community member browsing the subjects tends to decrease.

First solutions in mind

We can think some usual solutions for this scenario, like:

5 11
2 404

Now available on Open Exchange is a library of third party charts available to use within DeepSee/InterSystems IRIS BI dashboards. To start, simply download and install, select the new portlet as the widget type, then select the chart type that you desire. If you don't find the type of chart you are looking for, you can easily extend the portlet to implement your desired chart type. These new chart types can be used within existing dashboards or you can create new dashboards using them.

4 0
0 874

Keywords: PyODBC, unixODBC, IRIS, IntegratedML, Jupyter Notebook, Python 3

Purpose

A few months ago I touched on a brief note on "Python JDBC connection into IRIS", and since then I referred to it more frequently than my own scratchpad hidden deep in my PC. Hence, here comes up another 5-minute note on how to make "Python ODBC connection into IRIS".

1 0
1 1.8K

Making a Chart using Intersystems IRIS + Python

How to use the IRIS Native API in Python to access globals and plot some charts.

Why Python?

With a large adoption and use in the world, Python have a great community and a lot of accelerators | libraries to deploy any kind of application.
If you are curious (https://www.python.org/about/apps/)

4 1
0 395

Hi colleagues!

Every day Johns Hopkins University publishes new data on coronavirus COVID-19 pandemic status.

I built a simple InterSystems IRIS Analytics dashboard using InterSystems IRIS Community Edition in docker deployed on GCP Kubernetes which shows key measures of the disease outbreak.

This dashboard is an example of how information from CSV could be analyzed with IRIS Analytics and deployed to GCP Kubernetes in a form of InterSystems IRIS Community Edition.

Added the interactive map of the USA:

19 13
3 939