Hey Community,
Enjoy watching the new video on InterSystems Developers YouTube:
⏯ Reporting & Business Intelligence: What's New? @ Global Summit 2022
InterSystems Business Intelligence enables you to embed business intelligence (BI) into your applications so that your users can ask and answer sophisticated questions of their data. Specifically, your application can include dashboards, which can include the following:
In contrast to traditional BI systems that use static data warehouses, Business Intelligence is kept closely in synchronization with the live transactional data, as required for your business.
Hey Community,
Enjoy watching the new video on InterSystems Developers YouTube:
⏯ Reporting & Business Intelligence: What's New? @ Global Summit 2022
When we work with IRIS, we usually have the ability to quickly deploy a ready-to-use infrastructure for BI (data, analytical cubes, and IRIS BI dashboards) using modules. When we start using Adaptive Analytics, we typically want to have the same functionality. Adaptive Analytics has all the tools that we need. The documentation contains a description of how to work with an open web API. All interactions between the user interface and the engine also occur via the internal web API and can be emitted.
When we are at the starting stage of BI project development, we must remember that it is crucial to select the right tool for its implementation. Today we want to show you how one of the principal functionality of dashboards is implemented in different BI systems. Let's talk about drill down from both points of view: the dashboard development, and the convenience and clarity for the end user. We will touch on the applications of this technology in IRIS BI, Power BI and Tableau.
In IRIS BI, cubes initially provide hierarchies according to which drilldown will later occur.
InterSystems Developer Community analytics. Project made with InterSystems IRIS BI (DeepSee), Power BI and Logi Report Designer to visualize and analyze members, articles, questions, answers, views and other pieces of content and activity on InterSystems Developer Community.
You can see your own activity, articles and questions. Track how your contribution changes developer community.
Analyse statistics about you and your friends using IRIS BI, Adaptive Analytics, InterSystems Reports, Tableau and Power BI.
Power BI dashboards provide us with a good way to analyze aggregated information. We can even choose time periods for aggregation (you can find more details regarding it in our article about drill down). However, we might still be interested in a detailed look at specific data points. With the right data filling, we can display detailed data for any column of the chart with all filters applied to that chart.
Hello,
I am still trying to figure that Calculated Measure stuff and I hope to learn from you. I have several cubes I am trying to create calculated measures using the Calculated Member Expression.
I have a cube called Cards. There is a measure called count that give total cards count of 15,000. There are two dimensions I am considering. One is the CreditGrade (A, B, C, D, nograde) and the other is the date of the scoredate.(2000-2015).
The CreditGrade dimension has two hierarchies. H1 being the creditnumber and H2 being the CreditGrade (The one I need).
Hi,
I have 3 simple tables: Encounter, Patient and Immunizations. Encounter makes a reference to Patient, and Patient contains a list of Immunization objects.
I've tried using PowerBI to access IRIS (using ODBC connector, not InterSystems BI connector), PowerBI reports the error:
Expression.Error: The column 'Patient' of the table wasn't found.
Details:
    Patient
it does this for two of the three tables I need only (Patient and Encounter), but not for Immunization IRIS table..
Anyone know why and how to fix ?
Thanks - Steve
Hi All,
I am looking for a reporting tool (Analytics purpose) which can be built using cache object script/MUMPS. Basically my requirement is to find a tool where I can implement cache code to report data for my application.
I am unaware of DeepSee and how it works. Please assist for the same.
InterSystems IRIS Business Intelligence allows you to keep your cubes up to date in multiple ways. This article will cover building vs synchronizing. There are also ways to manually keep cubes up to date, but these are very special cases and almost always cubes are kept current by building or synchronizing.
The build starts by removing all data in the cube. This ensures that the build is starting in a clean state. The build then goes through all records specified by the source class.
Selective Build is a BI feature in InterSystems IRIS (introduced in version 2020.1). Selective Build allows you to build specific elements of your cube while keeping your cube online.
Before getting into the details of Selective Build, a brief recap of the different phases during a regular cube build is important.
Is there any open source tool like Power BI or Tableau that works well with IRIS? Thx!
When designing a hierarchy in DeepSee, a child member must have only one parent member. In the case where a child corresponds to two parents, the results can become unreliable. In the case where two similar members exist, their keys must be changed so that they are unique. We will take a look at two examples to see when this happens and how to prevent it.
There are a handful of states with a city named Boston. In my sample data, I have records from both Boston, MA and Boston, NY. My dimension is defined as: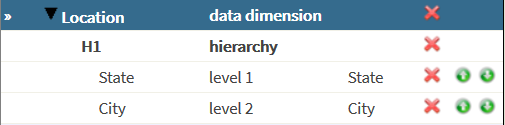
City and State are simply strings in my case.
Hi -
I'm trying to get my Combo Chart to dynamically scale the Y axis, but it's not doing what I would like. The 1st Y series, if the MAX value is set to null, scales the chart and the series fine, but then the subsequent Y axis are not to that same scale. Each "null" Max'ed series is setting it's own scale based only on it's own ranges and not in sync with anything else.
Is there a way to force all of the "null" scaled columns to be in the SAME scale as each other AND be dynamic.
Is it supported to be able to use member functions to define a set, in particular a set defined with a member range in the form:
set = member1:member2?
The docs only show hardcoded values being used for member1 and member2 and I can get it to work if I use hardcoded values. However if I try to use member functions it throws an error:
"ERROR #5001: Both parts of a range must be members"
.png)
While the below does not give me the correct answers without using the %All function, it does work.
Hi All,
We have been using DeepSee which has been the integrated Analytic Dashboard built over Cache Cubes. It works fine but it's visual capabilities are limited and most probably is getting phased out.
If I am not wrong, Tableau is the suggested alternative to DeepSee .
I participate in InterSystems Datasets Contest. I created dataset-finance and analyze-dataset-finance apps along with Online Demo.
The username is _SYSTEM and password is SYS. I created an online demo with a pretty dashboard here:
I wanted to create my own pivot table and went to regular management portal:
https://finance.demo.community.intersystems.com/csp/sys/UtilHome.csp
We can access Analyzer in USER namespace directly:
Hi,
Is there any way by which we can incline the Value Labels in Bar chart like on top of bar or outside of bar in InterSystems Dashboard like Other reporting tool.
Please find the below snip for reference ,
.png)
Thanks,
Ravi
There is a basic introduction video about DeepSee shell on InterSystems video portal.
Key points in this video:
•Invoke DS shell command, generate MDX in Analyzer, copy in shell;
•Cube command, Select statement and Create statement
•Clauses: With, solve_order, Format_string
I have just created a new Global Master Topic, "IRIS Cheatsheets". IRIS has introduced a lot of new functionality, especially in scripting languages, FHIR R4 support, enhanced Interoperability Tools, and IRIS Analytics. Having spent 35 years working on Windows-based PC's and Laptops, I have surprisingly little knowledge of Linux, Docker and Git. Furthermore, I have written almost every application and Interface in ObjectScript with splatterings of SQL, .Net, and Java Gateways and the most basic knowledge of WinSCP, Putty, SSH. All that changed when I received my first Raspberry Pi.
I regret getting a late start in the InterSystems Analytics contest. I had tried a couple of times before to use Analytics, but I had not gotten too far. I have been recording financial transactions in Excel workbook ever since I had to retire Microsoft Money. Since my iris-for-money was not fully functional, I created a worksheet per account I was tracking. I had developed a CSP page in iris-for-money to import transactions by reading a CSV file. I realized this process requires escaping many characters that can cause the process to fail.
Hi Developers!
We had a set of technology bonuses for the InterSystems IRIS Analytics contest.
And here is how projects collected it:
Previously I have already tried to play with Google Data Studio when I connected it to InterSystems FHIRaaS. It has quite a nice UI, with a few chart types available out of the box, it can be quite easily connected to some plain tables (stored as CSV or JSON, for instance), and gives the ability to build quite flexible analytics over it. So, I have decided to implement a new connector to InterSystems Analytics (DeepSee), with the ability to select a cube and do some queries on it.
.png)
How Can I resolve this?
ERROR #5001: Failure to determine first and last IDs in source table 'dc_irisbi.KeyResult'. Check indices on the source.
I trying to use this class in a deepsee cube, when I build, I get this error
Hi Developers!
Here're the technology bonuses for the InterSystems Analytics contest that will give you extra points in the voting.
Adaptive Analytics (AtScale) Cubes usage - 4 points
InterSystems Adaptive Analytics provides the option to create and use AtScale cubes for analytics solutions.
You can use the AtScale server we set up for the contest (URL and credentials can be collected in the Discord Channel) to use cubes or create a new one and connect to your IRIS server via JDBC.
The visualization layer for your Analytics solution with AtScale can be crafted with Tableau, PowerBI, Excel, or Logi.
Hi developers!
How to build an analytics solution with InterSystems IRIS?
To begin with, let's agree on the points of what is the analytics solution - and this could be a very wide topic. Let's limit the set of solutions to those you can present in the Analytics contest.
There are three kinds of analytics solutions that we will review here: monitoring, interactive analytics, and reporting.
Monitoring
The typical monitoring solution consists of an online dashboard with KPIs that are being actively updated.
The key use case is of monitoring is to visually observe the KPI of fresh data every moment to react in case of an emergency.
Interactive Analytics
This solution supposes a set of interactive dashboards with filters and drill-downs.
The key use case is to explore the data with filters and drill-downs making business decisions upon graph and table data visualization.
Reporting
Reporting solution provides a set of static (usually) reports in a form of HTML or pdf documents that deliver the data in graph and text form in a predesigned form and could be sent via email.
The typical use case of a reporting system is to obtain reports on a given period that will illustrate the status of the product, process, service, sales, etc that is crucial for the business.
How InterSystems products could be used to build such solutions? Let's discuss this below!
Sometimes you when create a pivot in Analyzer and see the result that shouldn't exist - don't run to create a WRC ticket, try to call the IRIS BI reset function first:
d $System.DeepSee.Reset(1)And in many cases this will solve the problem.
And if it doesn't help, create a WRC ticket )
Hello!
The schedule into October 2021 for live virtual classroom training with hands-on exercises is available at classroom.intersystems.com.
In particular, we'd like to highlight a few courses currently only available once through October:
Click here to register for a course!
As always, we also provide the option to schedule a class specific to your company.
Is there a way in BI (DeepSee) to compare current value, to a value of a previous year?
For example I can hardcode this explicitly:
.png)
But I want in a widget to filter by year (1st column) and get the value for a previous year in a next column. YTY would be even better.
What MDX functions should I use? Examples?
When you have been using cubes for business intelligence in a namespace for some time, you may find that there are many cubes in the namespace, only some of which are actively being used. However, it can be difficult to tell which cubes users are or are not querying, and maintaining unused cubes can be costly both in terms of storage and of computation to keep them up to date. This article provides some suggestions and examples for monitoring which cubes are in active use, and for removing cubes that you determine are no longer necessary.
Following instructions on this page https://docs.intersystems.com/latest/csp/docbook/Doc.View.cls?KEY=D2IMP… I am trying to create a Data Connector to be used as a base class for a cube with update support.
That page suggests that putting an SQL query inside XData block is not suitable for a Data Connector that supports updates.
Later it also suggests that to enable updates your SQL query must include
WHERE $$$RESTRICT
Providing an example of it in XData block example like this
<sql>SELECT A,B,C FROM MyApp.