Hi guys!

I'd like to present you my new project: iris-analytics-notebook, a notebook approach to use IRIS analytics capabilities.

Project description

In past few years, notebooks tools like Jupyter are gaining popularity due its natural way to express ideias.

An almost unipresent tool for data scientists, notebook can also help to improve the impact of analytics tools for all sort of users.

2 0
0 200
Article
· Dec 31, 2019 3m read
Portlets that use data from DeepSee


In the previous part of this series, we saw how to reference a web page that will enhance our dashboard experience. Now we will look into referencing data that is already in our cubes.

In this example, we will be referencing the controller object and we will be extracting data from it. This data will then be displayed as text in our Dashboard. In Part 5, we will show how to incorporate this data into other charting libraries.

2 0
0 215
Article
· Sep 9, 2022 1m read
DC Analytics Open Application

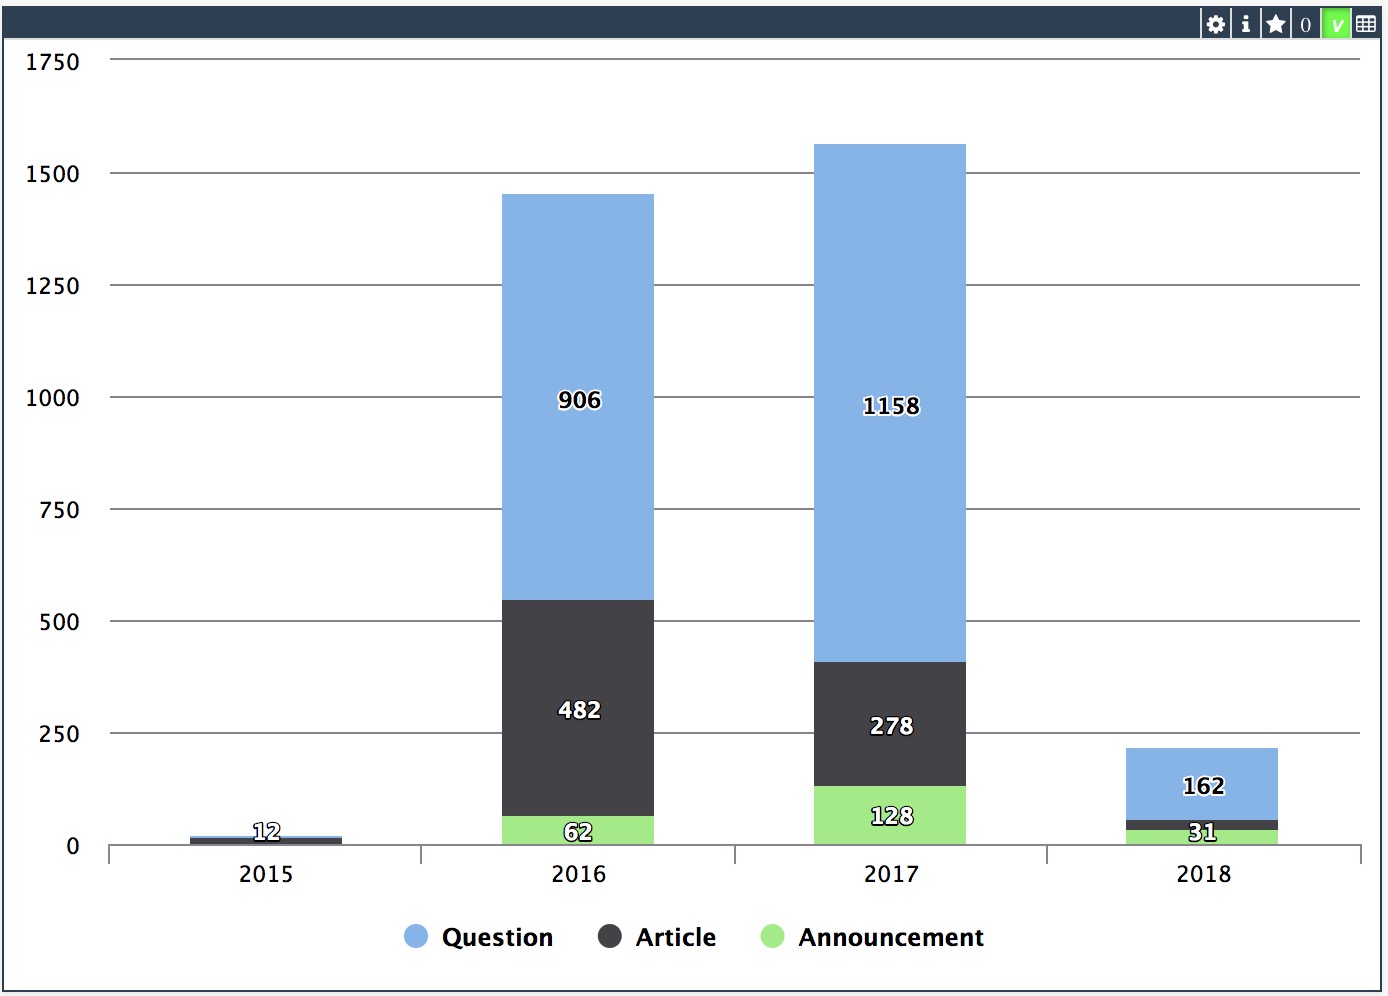
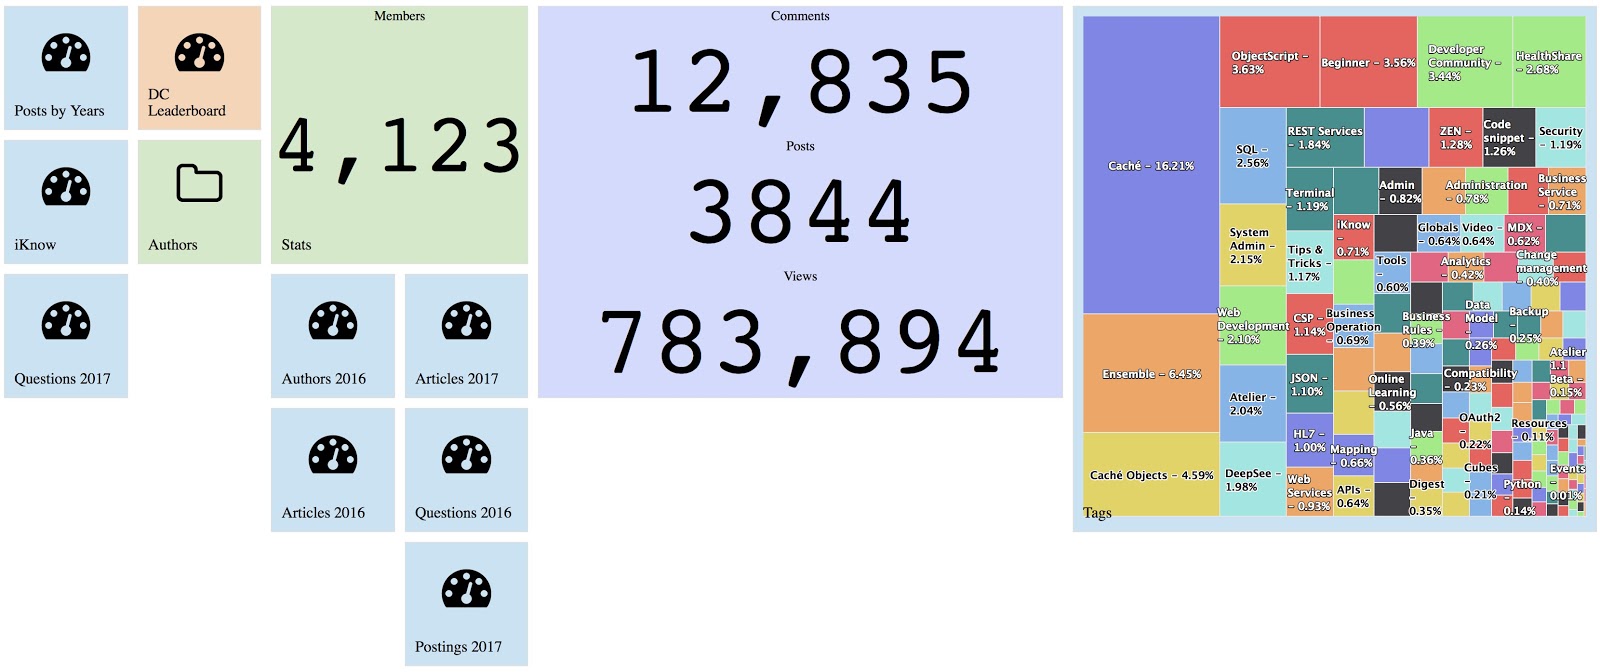
InterSystems Developer Community analytics. Project made with InterSystems IRIS BI (DeepSee), Power BI and Logi Report Designer to visualize and analyze members, articles, questions, answers, views and other pieces of content and activity on InterSystems Developer Community.

You can see your own activity, articles and questions. Track how your contribution changes developer community.

2 0
0 257

The DeepSee Shell best Practices Series - Execute an MDX query in the DeepSee Shell with/without results cache

This cache is different from cache reset. Cache reset clears everything in the namespace but “cache off” only clears the cache in ^DeepSee.Cache.Results and ^DeepSee.Cache.Axis global node for the corresponding cube. The difference is quite smaller in the case as below, but in some cases it can be a big difference.

2 0
0 406

When we work with IRIS, we usually have the ability to quickly deploy a ready-to-use infrastructure for BI (data, analytical cubes, and IRIS BI dashboards) using modules. When we start using Adaptive Analytics, we typically want to have the same functionality. Adaptive Analytics has all the tools that we need. The documentation contains a description of how to work with an open web API. All interactions between the user interface and the engine also occur via the internal web API and can be emitted.

2 0
0 202

Hi, Community!

If you do not know much about DeepSee technology, this video on is exactly for you:

DeepSee Webinar

https://www.youtube.com/embed/4P45m6LjhPE
[This is an embedded link, but you cannot view embedded content directly on the site because you have declined the cookies necessary to access it. To view embedded content, you would need to accept all cookies in your Cookies Settings]

2 0
0 209

In the previous part of this series, we saw how to include data in a portlet from within DeepSee. This used the built in data controller. In this part, we are going to be pulling in data from outside of DeepSee. This will include both information from within InterSystems IRIS and from the OS.

Why use this?

This is useful if you would like to create a dashboard that only contains information about your system. It is also useful if you want to display data about your system along side data that you have stored in DeepSee.

2 0
0 312

The DeepSee Shell Best Practices Series - Example of using the MDX subquery flag in the DeepSee Shell

We have different flags for DeepSee advisors to look into the execution details and the methods DeepSee is using to do calculations.

flag [flagname] [on|off] – Turn a diagnostic on or off.

flag cmbr on|off – Show current member processing.

flag compound on|off – Show rewrite of compound queries.

2 0
0 433

Hi All, We have been using DeepSee which has been the integrated Analytic Dashboard built over Cache Cubes. It works fine but it's visual capabilities are limited and most probably is getting phased out. If I am not wrong, Tableau is the suggested alternative to DeepSee . It is expensive and a big and considerable shift from existing technology I wanted to get an opinion of the community as to these few key points - What other BI tools others have been using with IRIS and what have been their experience - For which tools are the best inbuilt support / api's avaialble in IRIS

2 10
0 510

Developers, we have prepared a tutorial to get you started with InterSystems Adaptive Analytics powered by AtScale. In it, in addition to setting up AtScale and working with data cubes, we will also touch on methods of working with InterSystems Reports and other analytical systems.

Now the course is ready and we want to conduct a pilot training course on a small group of volunteers (3-5 people).

2 1
0 275

Today my customer ask me a question about how to write the MDX with a summary row however this row with different aggregate functions for each column.

We know in DeepSee analyzer has pivot table option "Summary", user can select sum, avg ... aggregate functions to get the summary row/column. However we can not specify different aggregate function for each measure column.

Here show the example to use All level and IIF function achieve that. see the example (Holefood cube in Sample namespace) below

WITH MEMBER measures.[with avg summary info] AS

2 6
0 1.1K

Hi, Community!

You know, that when we build hierarchies in DeepSee dimension all the members of lower level should be the part of one member of the higher level.

If not you'll get some empty results in MDX queries with this hierarchy.

With Time dimensions the obvious valid hierarchy is Year->Month->Day, cause every Month consists of one Year and every day consists of one month.

2 3
0 393

Hello InterSystems Community,

We're excited to announce that we've completed our first Open Exchange submission for InterSystems platforms.

BridgeWorks VDM is an ad hoc reporting and graphical SQL query builder application that was designed for any user who needs access to their SQL projections in InterSystems Caché, InterSystems IRIS, InterSystems IRIS for Health databases as well as access to InterSystems DeepSee and InterSystems IRIS BI Cubes with minimal SQL scripting experience.

VDM features:

2 0
1 422

I want to have a generic PercentOfAll measure that can be used for any dimension of the cube. This PercentOfAll should act like Count, but instead of showing the number of rows in a cell, it will show the percentage (100*number of rows for that member/all rows) .It should not matter what dimension is being viewed. Ex

There are a total of 100 rows in the source class.

1 1
0 311

System Monitor is a flexible and highly configurable tool supplied with Caché (Ensemble, HealthShare), which collects the essential metrics of the operating system and Caché itself. System Monitor also notifies administrators about issues with Caché and the operating system, when one or several parameters reach the admin-defined thresholds.

1 2
2 1.3K

In DeepSee, having a customer account cube. The cube includes a time dimension AccountCreationDate.

How do you create a calculated measure to get the total number of accounts from the beginning to a certain date in abscissa ?

I tried many things including this:
AGGREGATE(%TIMERANGE([AccountCreationDate].[H1].[MonthYear].&[190001],[AccountCreationDate].[H1].[MonthYear].CURRENTMEMBER) ,[Measures].[%Count])

But I don't get the right result because the date in abscissa creates a filter on the first date.

1 2
0 844

Hi Community,

I am using a method taht calls a Dashboard in Deepsee web from an application , but I want to know if it's possible to not showing the header, this part that have the search button, the name of the namespace, etc..

This is the method :

Method %OnAfterCreatePage() As %Status
{
//Set contratistaId = $Get(%session.Data("ContratistaId"),"")
//Set gerenciaId = $Get(%session.Data("GerenciaId"),"")

1 10
0 502

BridgeWorks is pleased to announce a VDM, v9.1.0.1. This release includes the following updates:

Updates

  • Historical Linking is now based off connection profile name
  • Saved Formatting is now based off connection profile name
  • Tables and Fields column headers no longer hide based on connection type

Bug Fixes

1 0
1 197
Article
· Mar 2, 2020 2m read
SQL -99 error while viewing a listing

This error is sometimes seen while viewing a listing in InterSystems IRIS Business Intelligence:
ERROR #5540: SQLCODE: -99 Message: User <USERNAME> is not privileged for the operation (4)

As the error suggests, this is due to a permission error. To figure out which permissions are missing/needed, we can take a look at the SQL query that is generated. We will use a query from SAMPLES as an example.

1 0
0 772