Debugging is the process of finding and resolving defects or problems within a computer program that prevents the correct operation of computer software or a system.
Following 2 local Webinars we had focused on VS Code ["Intro" and "Beyond Basics"; in Hebrew], I prepared for the participants some related links of relevant resources which we sent as a follow-up. Sharing them here as well for the benefit of the Community. You are all of course welcome to add more useful resources.
When there's a performance issue, whether for all users on the system or a single process, the shortest path to understanding the root cause is usually to understand what the processes in question are spending their time doing. Are they mostly using CPU to dutifully march through their algorithm (for better or worse); or are they mostly reading database blocks from disk; or mostly waiting for something else, like LOCKs, ECP or database block collisions?
In this article, I'm excited to introduce my latest application, Journal File Indexer. The development of this application is rooted in the portal idea DPI-I-270.
In short, this application lets you load and index a log file in a database.
Why?
If you've ever used the log file search function in the management portal, you may have encountered a timeout error or even a blank page. This problem usually occurs when searching a large journal file. Journal File Indexer solves this problem by considerably increasing the speed of searches once the file has been loaded into the database.
Another problem arises during the restoration process. When searching for global entries in a log file to restore old or new values, the management portal doesn't have this specific functionality. A routine must therefore be coded to achieve this. Journal File Indexer comes to the rescue, incorporating a restore function!
We have several clients in different productions all accessing a web-service. We are trying to add another client in a new production, and its not working. The messages between the relevant Process and the SOAP web-client Operation are the same in the working and the non-working productions. But the web-service is reporting an XML parsing error to the non-working production. Here's the error as reported in the SOAP web-client Operation...
I am currently debugging a piece of code relying heavily on macros. I am using breaks in the method to then check the values of macros and object properties as I go. However, any time I invoke a macro within a break I get an error. To get around this I am converting the macro calls into the underlying code. Some of these macros have messy translations and this is somewhat time consuming. Is there an easier way to access macros from within a break?
I'm at a loss with configuring the IRIS ODBC driver (v02.10) on my Amazon Linux machine, connecting to a REMOTE IRIS backend. It should be simplified by not requiring a DSN (the app uses a DSN-less connection and generates the connection string). I have
With the world (as well as our own technology) moving to the cloud at such a fast pace it is easy (at least for myself) to get caught up in the little details. One thing I, and some clients of ours, had run into a couple of times was the necessity to specify the version of the images one plans to use with the IKO.
I have created a Business Operation (BO) named "Sender" that sends HTTP messages to an endpoint (for testing, I'm using Postman's Mock Servers).
Goal: I want to set up an automatic timeout mechanism so that if I don't receive a response from the server within 18 seconds, an alert is generated and the message is resent. This process should be repeated every 18 seconds, for a maximum of 90 seconds. If no response is received within 90 seconds, I would like to generate an error message. On the other hand, if a response is received, I want to stop the resending process and complete the operation by indicating successful reception.
Hi I am trying to run a debugger in VS Code. I have the settings.json file and the launch.json file. I am trying to debug code using the attach to a process method, however when I run the debugger I get the following error.
Launch.json code
{
// Use IntelliSense to learn about possible attributes.
// Hover to view descriptions of existing attributes.
One of our development Ensemble instances is misbehaving. We suspect we'll just need to reinstall it - which would be a hassle. Before we do, we wanted to check we weren't missing some kind of easy fix. The symptoms we are seeing:
If you ever wondered how to debug some requests that are being made to or from IRIS, well here is a little tutorial on how to do that.
During a complex project, usually you get the specifications and implement the communication between IRIS and other things based on that. But from the paper to the real world there's usually a huge gap and you need to know why you are receiving an error on a parameter, on a header, you are not receiving the data and so on.
Is CR/LF changes to DTL files edited/committed to git via VS Code a known issue?
We had an issue with exporting files from one server and importing on another, using XML code exported from Studio: ERROR #6301: SAX XML Parser Error. Turns out that issue was down to CR/LF changes made when transferring the XML from one server to the other.
On a developer's laptop, having had two or three Ensemble installs with different settings/config changes made, and encountering unexplained errors compiling classes, wanting to scrub as much of the previous installs off the machine before doing any fresh installation... But can't find clear documentation on doing a complete uninstall!
Have stopped the server.
Am I safe to remove C:\InterSystems\Ensemble (for the instance installed into that folder)?
Exported contents of a namespace on one server (classes, include files and lookup tables). Importing that code into a newly created namespace on another server. Both servers Ensemble 2018.1, same build. Export was via InterSystems Studio. Export is around 18Mb in total (XML file sizes).
When importing and compiling on the new server, getting errors as below - with #6301: SAX XML Parser error prominent - on a number of the imported files, all containing data transformations or business processes.
I was wondering if anyone had any input on how to troubleshoot classes in a terminal session? I'm currently writing an "adapter" so that way we can encrypt and decrypt files through GNUPG (PGP keys).
I'm pleased to announce version 2.6.0 of the VS Code ObjectScript extension, containing a number of enhancements that make a developer's life easier. Some highlights are described below. As always, find the full list of modifications in the CHANGELOG, including many bug and vulnerability fixes.
When I try to debug using the docker image intersystemsdc/iris-community it is failing. If I change to intersystemsdc/iris-community:2022.3.0.555.0-zpm, I have success.
Sorry, change to: intersystemsdc/iris-community:2022.1.0.209.0-zpm
Very simple, how to debug? The settings recommended in the docs don't work. I need a convenient way to keep track of what a function returns, like in other languages, by displaying it in the console.
I am currently trying to better my development process by using Visual Studio Code because I'm more familiar and comfortable with it than Studio.
I've followed the guide here, but I'm still having issues. I initially didn't have the Web Socket protocol allowed on my Web Gateway server, but I enabled that and restarted the server with no luck.
Visual Studio Code (VSCode) is the most popular code editor on the market. It was created by Microsoft and distributed as a free IDE. VSCode supports dozens of programming languages, including ObjectScript, Until 2018, Atelier (based on Eclipse). It was considered as one of the main options to develop InterSystems products.
I've faced a problem that happens while debugging a process in VSCode. It doesn't seem to matter if this is in a container, on my development VM, or against a locally installed version of IRIS. The problem seems to be mostly with X12 Documents.
So, in a debug session, I can dump out a value to the debug console and it loos correct. The same variable in VSCode appears to be some uninitialized memory location.
I'm using Insomnia software for testing my REST applications from cache and wanted to know how do I debug POST that got sent into backend by this tool via json sent from the request body!
Only a few days to go until the Global Summit! George James Software will be on hand to talk about any projects you may have on the horizon, such as application development, data and platform migration, system integration, training, and support – we can work with you to find practical and maintainable solutions that support the growing needs of your organization.
We're also running a User Group Session on Wednesday, July 22nd at 12pm. It's a great opportunity to find out more about our tools and ask us (and current users!) any questions.
 By date
 Open Exchange app
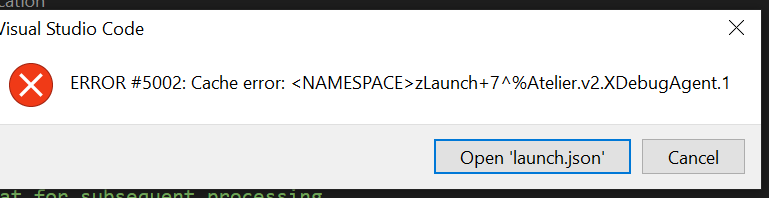
.png)