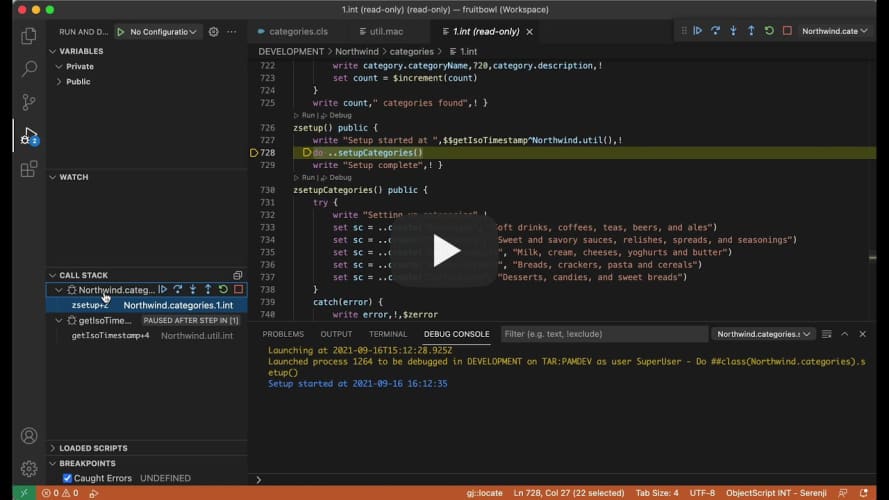
While I love using VSCode for IRIS development work, one of the persistent frustrations with it has been the inability to display an object hierarch in the variables window while debugging. Only the object's reference identifier is displayed. Cache Studio's handling of the same issue is a little clunky, but it does at least have the option to display something as an object.

For now, I make do with a combination of the watch window and the command line in the debugging console -- but this feels just a step away from log.debug()/console.log() level debugging sometimes.

0 2
0 331
Article
· Jun 13, 2016 1m read
Debug: using locks for breakpoints

Hi, Community!

Want to share with you one debugging approach from the Russian forum.

Suppose I want to debug the application and I want it to stop the execution on a particular line.

I add in code this line:

l +d,-d

When I want to start debugging in this line I block d in terminal

USER> l +d

And execute the app.

The app stops on this line and lets me connect to it with Studio debugger.

0 8
1 602

SET ^||fruit(1)="apple",^||fruit(4)="banana",^||fruit(8)="cherry"
SET ^||fruit(1,1)="Macintosh",^||fruit(1,2)="Delicious",^||fruit(1,3)="Granny Smith"
SET ^||fruit(1,2,1)="Red Delicious",^||fruit(1,2,2)="Golden Delicious"
SET ^||fruit="Fruits"
ZWRITE ^||fruit

^||fruit="Fruits"
^||fruit(1)="apple"
^||fruit(1,1)="Macintosh"
^||fruit(1,2)="Delicious"
^||fruit(1,2,1)="Red Delicious"
^||fruit(1,2,2)="Golden Delicious"
^||fruit(1,3)="Granny Smith"
^||fruit(4)="banana"
^||fruit(8)="cherry"

0 4
0 499

I am experiencing a problem with an EDI process that uses a SQL Batch Service to connect to our DEV environment. However, when we point the EDI service to our TEST server, it errors out.

I have checked every single property on our TEST and DEV servers as well as the properties on the associated tables. They are identical. Nothing has changed in the SQL either.

0 1
0 264

Hello,

I don't know if the title is accurate enough. I have a legacy code that I need to optimize. It's a routine written in objectscript. It accepts 4 parameters and runs 6 nested FOR...$ORDER reading a big global.

The thing is when I run the routine the first time it takes around 60 seconds to run. If I run it again it takes 5 seconds. If I wait around 6 to 10 minutes to run it again, it takes 60 seconds again, but if I run it every 1, 2, 3... minutes it still takes only 5 seconds to run.

0 9
0 416

We're hosting our Deltanji and Serenji user group session tomorrow - there's still time to register, if you haven't already.

We'll be showcasing some advanced features of Deltanji and Serenji in VS Code with time for a discussion - so feel free to bring along any problems you need help solving or share your feedback on our tools. We'd love to hear your thoughts. If you're interested in our tools this is a great chance to hear what others have to say, as well as asking your own questions.

Date: Wednesday, November 3rd

Time: 11-12pm EDT / 3-4pm GMT.

Let us know you'll be attending on Eventbrite.

We hope to see you tomorrow, but if you're unable to make it you can email me at laurelj@georgejames.com and I can share a recording of the session.

0 0
0 124

If I open a terminal and type the following commands, sc is an error:

set validator = "sc = ##class(%Library.Numeric).IsValid(""BLAH"")"
set @validator
write sc

At the end, when I write sc I get:

0 L'BLAH9
             DOCXT010,#e^zIsValid+1^%Library.Numeric.1^1e^^^1

However, if I call the following class method using the arguments "%Library.Numeric" and "BLAH", sc is undefined

0 12
0 383

Hi developers, 

We've incorporated VS Code's support for multiple concurrent debug sessions and consoles into the latest release of Serenji

So if you're working with processes that relate or are dependent on each other, you can now debug them together. Just launch a second Serenji debug session (F5) whilst the first one is still active. 

This short video below shows how it works. We hope you find this feature useful! 

Laurel 

Serenji 3.2 multiple concurrent debug sessions

0 0
0 163

How to find a global's original namespace ? Potentially mapped from a different namespace .

I have a global ^Custom that exists in multiple namespaces but it could mapped from namespace Drone(A) to Launch(B)

Without access to Cache management portal how to find where is my global located using cache code ?

Like if ^Custom == ^[Drone]Custom ??

0 5
0 311

Hi,

I'm getting thousands of errors like the ones below:

2021-05-03 14:11:44 [SQLCODE: <-400>:<Ocorreu um erro fatal>] [Cache Error: <<READ>Dispatch+14^%SYS.BINDSRV>] [Location: <ServerLoop>] [Client info: <Username: KIORAS, Node Name: 3IK0VLS5UU, IP Address: 192.168.1.223, Executable Name: EXTRService.exe, Internal Function: B0>] [%protocol: <52>] $Id: //ce/2018.1.2/kernel/common/src/aclass.c#1 $ 23468 104

0 1
0 469

Hi

How do I view the .int code of a compiled class in VS Code?

I am trying to use gj::Locate and the setup works, the explanation is all fine but when i paste an error from the Error Logs into the gj::locate it firstly tells me that it can't find the .cls and when I paste in the .int reference in the text box where you can specify the class, method, line+offset it replies that it can't find the item.

This is something to do with the objectscript extension rather than gj::locate

Nigel

0 3
0 387

I have multiple projects that I utilize when debugging in Cache Studio. One of my projects suddenly lost the ability to step through commands with the yellow box and the cursor moving though code lines. The cursor just sits at the entry line while variables apparently do change. Interestingly enough, if I change the project and the debug target, the "yellow box" ability is still there. Apparently losing this functionality is by project/debug target/whatever. The goal is, of course to return it back but how?

0 24
0 552

Someone may have asked this before but is there a way to return the TRACE statements that we have placed in the Data transformation within the DTL Editor Testing Tool (EnsPortal.Dialog.TestTransform.cls)? Is this something we can get in an Enhancement request in for?

It would save sometime in troubleshooting where an error might be in the DTL.

Just wondering...

Thanks

Scott

0 1
0 251
Question
· Sep 11, 2020
Automatic Watch variables

I come from Visual Studio and now I use mostly Cache 2017 Studio. One debugging functionality I miss dearly is current local variables automatically appearing in the Watch Variables window together with their values. Yes, I can hover or type them myself but both actions take extra time which is especially noticeable when debugging unfamiliar code across many routines. Any Cache settings or plugins to that effect? If not then why not? And if nothing else is there in Cache, what are the alternatives or hacks in this respect?

Anna

0 12
0 311

Hi i have rules and i want to log them to analyse what rules executed , I want to add in the log Msg Controller Id, MRN, Value coming in the message, and my customize text telling whats wrong with this field... i have like 50 rules and at the end i can check the log table and found like 20 entries so it means 20 data issues are there for a given message control id. any advice how to to do it

0 3
0 220

Hi Developers

Is there any way that we can pass the values to the read prompts via cache routine.

For example, we have a couple of reports/routine in our system which accepts some inputs and after taking the inputs it generates some data. Right now it has proper UI and where User enters the value and in routines we have Read statements which accepts those inputs for further processing.

0 7
0 475

Running Cache 2017.2.2.

I'm trying to make a REST API call in JSON format. When using the example in the class reference documentation the getJSON method in the %Net.Http class throws the error <METHOD DOES NOT EXIST> on a %Clone() method in the %LIbrary.DynamicObject class. I even changed the parameter to a JSON string to no avail. The code will then fail on the %Compose method (examples below). My workaround is to use the %Net.HttpRequest functionality. Is there another workaround to this?

0 2
0 233

Hi everyone,

I have an existing application on HealthShare 2015 and decide to move it to HealthShare 2018 to make use of Atelier support. I am using Eclipse Photon with Atelier Plugin 1.3.

Most of things are working better on Atelier comparing with Built-in studio of HealthShare. However, when I tried debugging CSP file with Atelier I encounter 2 problems:

1.

0 1
0 318

Hello,

I am reading in an X12 document into my production that needs to be processed and returned as a CSV file. I have created a record map to support the fields I want to extract with a batch class to store headers. I have a DTL mapping the data to the appropriate fields in the record map and am sending the record map to a EnsLib.RecordMap.Operation.BatchFileOperation.

0 2
0 792

Hi everyone,

I've encountered this annoying issue so many times before, if any one also encounter this issue, please share here if you have any solution.

So, I've been working on a web service project using HealthShare 2015. Sometimes I have to set a debug target to a csp file to debug it. If I pause the debug process about 3 minutes above or so (to examine an object, variable, etc..) the studio will hang.

0 4
0 376

Hello,

I have a couple of IOT devices that communicate via WebSockets to our backend.

I successfully managed to create a websocket connection between server and (iot)client using %CSP.WebSocket
However I would like to implement authentication on this using the HTTP headers at the same time of Connection: Upgrade.

I tried to set the headers to globals in order to debug but they are always empty.

Example code:

0 1
0 254