I have a widget that uses "choose Data source" control option. Termlist for the control consist of the two data sources and i want to set one of them by default. For example: I have two data sources, one is grouped by month, the other by year. I need to set the one that is grouped by year by default
Using default value at the bottom return an error
How can i achive that?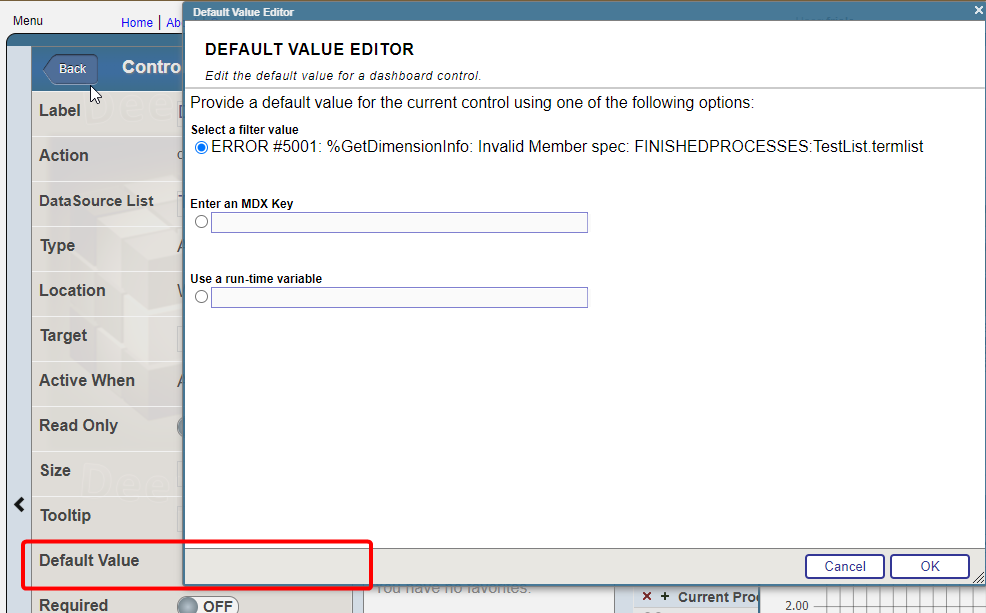
.png)
.png)
.png)
.png)
.png)