The row expression defines what dimensions and measures appear on the rows of your pivot table as well as how they appear. Sets and CROSSJOINs are used.
3394731190001
InterSystems Business Intelligence enables you to embed business intelligence (BI) into your applications so that your users can ask and answer sophisticated questions of their data. Specifically, your application can include dashboards, which can include the following:
In contrast to traditional BI systems that use static data warehouses, Business Intelligence is kept closely in synchronization with the live transactional data, as required for your business.
The row expression defines what dimensions and measures appear on the rows of your pivot table as well as how they appear. Sets and CROSSJOINs are used.
3394731190001
The source class of a DeepSee cube has a property referencing a different class:
Class ClassA Extends %Persistent {
     Property P1 As ClassB;
}
When records in class B change, the ^OBJ.DSTIME global for Class A will not be automatically updated. This means that synchronization of cubes based on source class A will not reflect the changes occurred to property P1.
This post will help you determine the best way to achieve synchronization of properties referencing a different class
Hi -
I need an example of what I need to "map" to have a common dashboard defined so it will visible/usable in multiple namespaces.
I have created a dashboard in "SAMPLES" (namespace and database) and I would like to have this dashboard be accessable/useable from a 2nd namespace, but I'm not having any success in doing mappings (global/package/routine/data) to be able to get DeepSee to be able to see/display the dashboard.
What is the minimum that I need to map?
To deploy a DeepSee solution, the docs recommend that you define a namespace on the reporting (mirror) server, and "define mappings to access the application data, application code, DeepSee cube definitions, and DeepSee data on this server". (http://docs.intersystems.com/ens20152/csp/docbook/DocBook.UI.Page.cls?KEY=D2IMP_ch_overview#D2IMP_overview_architecture)
This implies that for an ideal deployment architecture, globals should be split into four separate databases (app data, app code, DS cubes, DS data). How exactly should the DeepSee-related globals be split?
Hi, Community!
I’m sure you are using Developer Community analytics built with InterSystems Analytics technology DeepSee:

You can find DC analytics n InterSystems->Analytics menu.
DC Analytics shows interactive dashboards on key figures of DC entities: Posts, Comments, and Members.
Since the last week, this analytics project is available for everyone with source code and data on DC Github!
Hi,
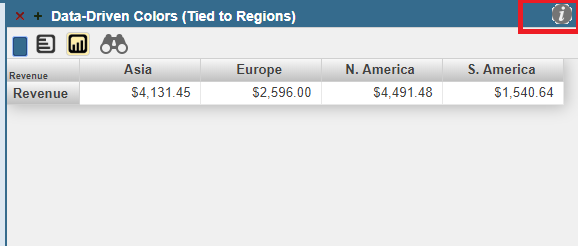
I want to include Info icon on DeepSee-Widget title bar like the image below. And when I click or hover on the icon it should display some information about the widget. I tried with the options available in Widget settings and referred InterSystems's documention as well, I couldn't find a way to get this.
Please help me to achieve this. Thanks in advance.
Hi community,
I'm in a proyect that I have to load data that cames from 3 different sources and one of these sorces is a csv file that contain the name of a switch and the name of a port. My cube have also this information, but I have to show only the values that match with this information. I'm trying to filter the cube through this method below, the problem was the result of the method is not only a value, it is an array with many values and I must use the IN operator and not this "&" symbol. I wanted to know if it's possible or not?
Result of : ‘acc23-mqui2.redip.clGi1/17’,’acc01-mqui2.
Hi,
My testers are getting this Internal Server Error inconsistently. There is no specific steps to reproduce this error. Can you any one explain when will we get this error in DeepSee.
Thanks in advance.
Hi,
I cannot edit properties (title etc) of Widgets within Dashboards outside of the ENSDEMO namespace:
I have a namespace "HL7Report" for example;
I have some Pivots created looking into a cube's data;
I click "DeepSee", "User Portal" from the Management Portal;
I click "+", "Add Dashboard", folder/name/title/category all as "new", "OK", new dashboard appears;
I click ">", "Widgets >", "+", and select a pivot to display as a table (chart / anything);
I then CANNOT edit the properties of the Widget, I click the ">" again and every Widget I create is "new (Closed)".
Hi hi,
Is there any way to do an automated daily print-to-PDF of a dashboard (its' widgets / pivots etc)?
I am able to add a "Print" Control to a Widget on a dashboard to do the default DeepSee Print functionality of a Control, but this is manual and browser dependent.
Is there a way I can either:
1) have say a scheduled task to automatically print the dashboard (as and instead of the manual Control click) including specifying filename?
Hi community,
I’m working in a project for a Chile Police and I need to know if it’s possible to build a hierarchy in Deepsee like Zone- Prefecture – Comisaria – Destacamentos (there are 4 levels of police units) , but these information are only in one table that has the code, the father ,description and UnitType. (it’s recursive) . Example:
|
UNI_CODIGO |
UNI_PADRE |
UNI_DESCRIPCION |
UNI_TIPOUNIDAD |
|
1 |
20 |
OTRA REPARTICION |
|
|
10 |
2.380 |
38A. COM. PUENTE ALTO |
50 |
|
20 |
DIR.NAC.SEGUR.Y ORDEN PUBLICO |
10 |
|
|
30 |
8.855 |
TENENCIA CARRETERA ARICA |
70 |
|
40 |
8.740 |
1RA. COM. ARICA (AGR) |
40 |
|
45 |
40 |
1RA. COM. |
Hello,
I have imported my data with the following code (%DocDB).
set filename = "/home/student/Dokumente/convertcsv.json"
IF $SYSTEM.DocDB.Exists("Fitabase1") {
SET db = ##class(%DocDB.Database).%GetDatabase("Fitabase1")
}
ELSE {
SET db = ##class(%DocDB.Database).%CreateDatabase("Fitabase1")
}
set arr = ##class(%DynamicAbstractObject).%FromJSON(filename)
SET jstring = arr.%ToJSON()
//SET doccount = db.%Size()
DO db.
Hi everyone.
I have a cube with two dimensions, DimA and DimB, with the following structure:
DimA/H1/LevelA
DimA/H1/LevelC
DimB/H1/LevelB
DimB/H1/LevelC
LevelC is modeled in such way because its bound property (C) is group by properties A and B in transactional database, but A and B haven't relation.
I can use DeepSee REST API service /Info/FilterMembers/:datasource/:filterSpec specifying each dimension one filterSpec parameter and handle the results.
But, I would like to have the results for both dimension in only on service call.
Is that possible?
Hi.
I would like to know if DeepSee has some feature regarding synchronization which could help me with this:
I have two tables, TableA and TableB in a 1:n relationship, and one cube for each table, CubeA and CubeB.
CubeA have a list dimension based on records from TableB.
Both tables has DSTIME parameter set to "AUTO".
Some application proccess updates data only on TableB, leading an entry on ^OBJ.DSTIME global for synchronization of CubeB.
However, as the TableA wasn't updated, there isn't such entry for CubeA.
Thus, filtering on CubeA dimension which depends on records from TableB is affected.
I was approached recently by and end use who wanted to perform analysis of their databases and see how they could save some space by picking data good for deletion without harming the application. As part of investigation, they wanted to know sizes of globals within datasets. This can be achieved by various means but all of them provide data in text form only.
I thought I might be a good tool for database administrators in general - to see global sizes in a graphical way.
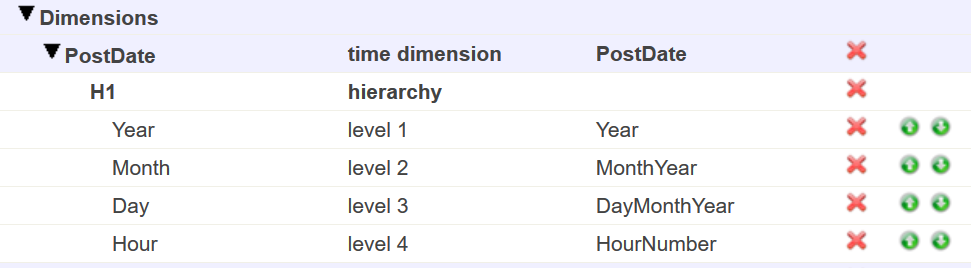
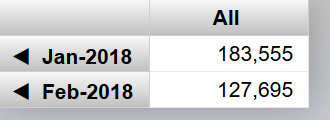
I have a server with rusw locale but in my cube the time dimension shows dates such as "JAN-2018". Is there a way to either localize that (preferably) or just output numbers like "01-2018"?
Architect:
Analyzer:
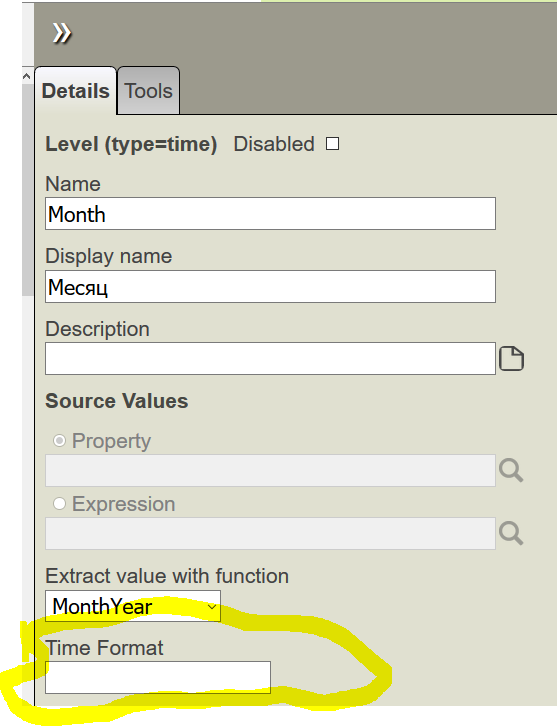
Also in architect, in level settings there is a "Time Format" property, what's that? Tried setting it to 3 but it didn't help.
The following post concludes the series with a list of all databases seen in the example for the fully flexible architecture.

Hi everybody,
I like to know how Ican determine the same colors of Series Detail of a graph that applies to all widjets. I created a theme based on a specific widjet and apply to others, but didin´t change the colors of the graph.
Thanks.
Jaqueline Krieger
The following post is a guide to implement a basic architecture for DeepSee. This implementation includes a database for the DeepSee cache and a database for the DeepSee implementation and settings.
Hi community,
When I export the cube and the pivots that I made and import to another environment , the calculated metrics and dimension and also de pivot variable didn´t appear in the other environment. Because of this the pivot that use these metrics show error when you try to open.
I want to know that this behavior is normal or exist a way that you can export everything, independent if you build inside the cube or inside analyzer.
Thanks.
Jaqueline Krieger
Hi, DeepSee experts!
I need to call a listing programmatically other than the default.
I can do that with %LISTING keyword. E.g. in Samples:
SAMPLES>d $SYSTEM.DeepSee.Shell()
DeepSee Command Line Shell
----------------------------------------------------
Enter q to quit, ? for help.
>>DRILLTHROUGH SELECT FROM [HOLEFOODS] %LISTING [Listing]

   #  ID   Date City Chan Prod Unit Reve Disc Comm
   1: 475  01/1 Madr Reta Life 1    0.92 20%
   2: 843  01/1 Manc Onli Frui 1    4.95 0%
   3: 808  01/1 Osak Onli Bund 4    79.8 0%
But how can I call custom listings in MDX? E.g.
Hi all.
I have some problem with getting data from external source (PostgreSQL) via JDBC and load it in DeepSee and I resolved some problems while writing this question :)
So..Below I proved my steps of working:
S Connection=##class(%Library.SQLGatewayConnection).%New()
S sc=Connection.Connect("jdbcurl","user","pass",0)
If $$$ISERR(sc) do $System.Status.DisplayError(sc) quit
S sc=Connection.AllocateStatement(.Statment)
S query="SELECT * FROM students"
S sc=Connection.Prepare(Statment,query)
S sc=ConnectionHi Evgency,
Effectively I have widjet with pivot which include dates in from different cubes/dimensions, but exists the relation between the two cubes.
I'm showing below the MDX query from one pivot that uses the date "Fecha Creacion" that comes from cube "EVENTOSPOLICIALES"
SELECT %LABEL([Measures].[%COUNT],"Cantidad de Encargos","") ON 0,
       NON EMPTY {[TipoEventoPolicialD].[H1].[TipoEventoPolicial].&[Encargo de Arma],
                [TipoEventoPolicialD].[H1].[TipoEventoPolicial].&[Encargo de Especies],
[TipoEventoPolicialD].[H1].[TipoEventoPolicial].Hi Community,
I have a dashboard with 4 widjets, two of them use the same filter date and the others two another filter date. I want to know if it's possible that when I selected a date in one widjet affected also the other widjet with the same date. I saw that the filter can affect all of the widjets or only one, the owner of the filter. The other thing that the client ask me, if exists the possibility to create a generic date and when the user choose the range of date, will affect all of the widjets, independent that are different dates.
Hi, Community!
This is the 3rd part of DeepSee Web story - Angular base UI for DeepSee Dashboards, see the beginning here.

By design, DSW provides an implementation for every widget in DeepSee library. But there are some extra features in DSW which make solutions built with DSW dashboards more functional. This article describes it.
I tried to learn DEEP SEE Analytics for our HealthShare "SAMPLES" Name Space. I followed our documentation and tried it. But my management portal analyzer and visual reporting fields are hidden. So Please help me for how do I use the deep see concepts and provide some examples or demo.
Thanks ,
Ponnumani G.
In part 1, part 2, and part 3 parts of this series we set up three user types. In part 4 we saw how to secure model elements and DeepSee items. In this last part of the tutorial we conclude with some remarks on DeepSee security and troubleshooting tips. In particular, we see how pivot tables in User Portal can be "hidden".

In part 1 we started working on a security model for DeepSee and create a user type having privileges typical of end users. In this part we are going to create a second user type with ability to edit and create DeepSee pivot tables and dashboards.


