InterSystems Business Intelligence enables you to embed business intelligence (BI) into your applications so that your users can ask and answer sophisticated questions of their data. Specifically, your application can include dashboards, which can include the following:
Interactive widgets that execute queries designed for specific user roles or for specific areas of your user interface.
Controls such as drop-down lists and data choosers that enable users to modify these queries.
Interactive drill options that enable users to view the displayed data in different ways.
Options to export, print, and send alerts to other users.
An option to launch the Mini Analyzer, which supports free-form analysis.
Execute custom actions that are provided as buttons or other controls.
In contrast to traditional BI systems that use static data warehouses, Business Intelligence is kept closely in synchronization with the live transactional data, as required for your business.
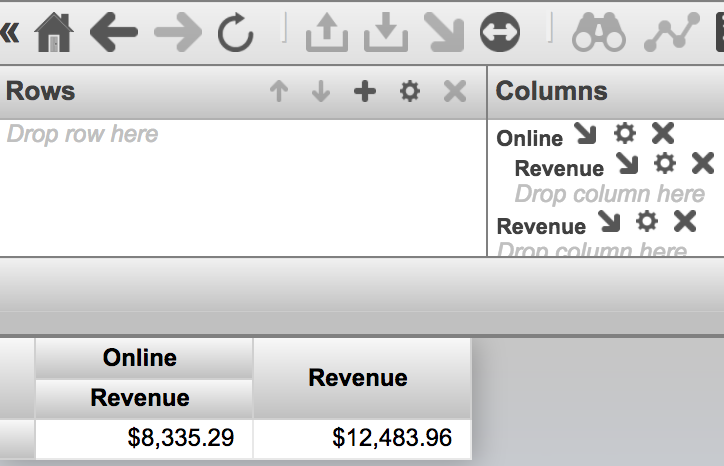
I am trying to create a query that returns the best and worst performing products for a given customer, based on this year's net sales versus last year's net sales, weighted by the total net sales for all of the products sold to this customer in the last two years.
I have created Last Year Net Sales (up to the last month end): AGGREGATE(PERIODSTODATE([Invoice Date].[H1].[YEAR],[Invoice Date].[H1].[Month].[NOW-13]),measures.[Net Sales])
Hello all, Can someone please tell me what will be the steps if I want to override css of deepsee dashboard widgets? Or if it's even possible. Thanks a lot.
I like to know how Ican determine the same colors of Series Detail of a graph that applies to all widjets. I created a theme based on a specific widjet and apply to others, but didin´t change the colors of the graph.
Is it possible to lock down health insight so a client can only query their own patients? and
Is there a way to use a visualization tool like Tableau instead of the dashboard of DeepSee while still querying from DeepSee?
I have recently studied deepsee and developed few dashboards needed for our web app users. I am trying to embed them in our existing web app which uses angular with delegated user access. I need to embed the native IRIS dashboard into it. ( I can't use Highcharts or any other js tools).
How do I setup the dashboards to work with delegated authentication (Without providing access to management portal or other parts) ? Also should I use the default csp/{Namespace}/_DeepSee.UserPortal.DashboardViewer.zen? or any other web application URL ?
As the title mentions, I'm trying to determine how best to handle an issue with nested data. Essentially I have a setting like the following:
Object A has a transient property with an array of Object B. I want to create a level with a list of Object B. I also want this level to contain properties belonging to each object B.
When creating pivots in DeepSee, there is the ability to group date dimensions by Day, Week, Month, Quarter, Year. For some of our reporting the Week option is desired. However the display looks like the image shown below. Notice the "YYYYW##" formatting.
Is there any ability within DeepSee to modify the display of grouped week dates? E.g. instead of 2020W14 it could be 03/30/2020-04/05-2020, or even just the start or end date, etc.
Hi, I'm new to the Analytics world in Intersystems and was attempting to print and/or export selected rows from a detail listing in a pivot on a dashboard. I am able to print and/or export all the rows; but if I select a specific set of rows, it prints out the entire detail listing; not the selected rows. Please advise on the best approach to accomplish this task. Thanks.
I need to create a KPI similar to the DeepSee.Model.KPIs.DemoTrendLines kpi in Samples. This kpi supports a scorecard widget with a trend line. It shows patient counts by city with a trend line of the count of patients over a decade. What I want is to show the trend line based on the average allergy score ([Measures].[Avg Test Score]). A pivot table query that shows the data I would want to base the trend line on is:
I'm stuck on how to show the top 15 payers and then also show the percentage of the total amount paid for each one. The total amount is what was paid by all the payers not just the top 15.
My group needs to be able to monitor items / tasks, and let a non-management-portal user see the monitoring. Is it possible to run DeepSee queries on Production items? I feel like I should not be recreating the production environment or the task manager just so that I can query on the items that are running, and on their states (like "successful" or "send email").
Also, I need to log custom events for each task, and I'm running into difficulties with the task manager in this regard; hence the question about using the Production instead, but querying it.
Hello, I've completed this tutorial: https://community.intersystems.com/post/deepsee-period-date-vs-same-peri... I've used the "year" level instead of a pivot variable. I want to calculate something like the following variation: 100 * ([DateOfSale].[PTD] - [DateOfSale].[LYPTD]) / [DateOfSale].[LYPTD] I create a new calculated member, under the same dimmension with the above expression.
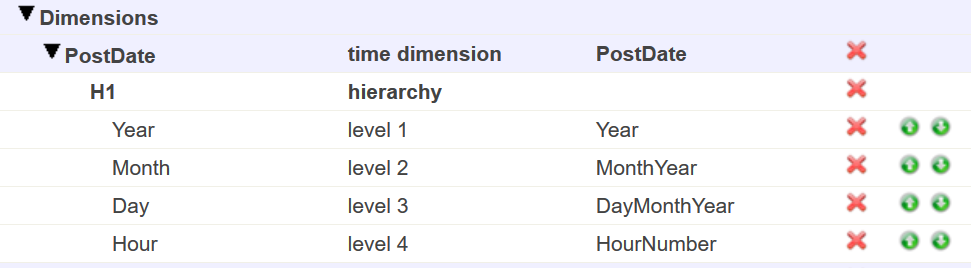
I have a server with rusw locale but in my cube the time dimension shows dates such as "JAN-2018". Is there a way to either localize that (preferably) or just output numbers like "01-2018"?
Architect:
Analyzer:
Also in architect, in level settings there is a "Time Format" property, what's that? Tried setting it to 3 but it didn't help.
Can someone tell me if intersystems-ru/deepsee-sysmon-dashboards is developed for a specific version of Ensemble? Looks like it could be useful to my group but we aren't upgrading till later this year and we are on 2015.2.2.
Working on "HealthShare 2019.1 [HealthShare Modules: Core:17.0.9941 + Patient Index:17.0.9941 + Clinical Viewer:17.0.9941 + Active Analytics:17.0.9941] - Cache for Windows (x86-64) 2018.1.1 (Build 312_1_18859U) Tue Mar 19 2019 00:43:30 EDT"
In creating a DeepSee Cube - Pivot - Dashboard I am not finding out how to sort my rows by the row label value.
My Rows are numeric values, but they are sorting lexically not numerically. By this I mean that given the Row Values 1, 2, 3, 10, 100 the rows ar being displayed in the Analyzer in the alphabetic order of:
We are currently developing a set of cubes in Unified Care Report (UCR) for data analysis purposes. However, we are encountering issues with cube dependencies, where certain cubes rely on others to be compiled beforehand. The complexity of these dependencies is becoming increasingly difficult to manage, particularly when attempting to deploy the cubes.
Hi! I am working on a project and I am facing a weird problem. I have created an MDX using Analyzer. This MDX executes very fast. I am trying to automate its execution with %DeepSee.ResultSet and the query never returns:
Set tSC = oMDX.%PrepareMDX(tMDX)
Quit:$System.Status.IsError(tSC)

Set tSC = oMDX.%Execute()
Quit:$System.Status.IsError(tSC)
What could be causing %Execute() to take so long to run while Analyzer is responding fast?
I was wondering if there was a DeepSee overview document available for a non-technical user. Something short and concise describing what DeepSee is and its key features.
I've looked at the documentation and although there are parts of what I am looking for there it is much too technical for my needs.
 By likes
.png)
.png)
.png)