I have a persistent class “sp.SensorReading” which has a number of Properties: Date, SensorName, SensorReading. (sometimes multiple readings from the same sensor, on a given day)
... Temp 28 Jan 33.5 Temp 29 Jan 31.2 Temp 30 Jan 33.1 Temp 30 Jan 34.1 Temp 31 Jan 32.1 Temp 31 Jan 33.1
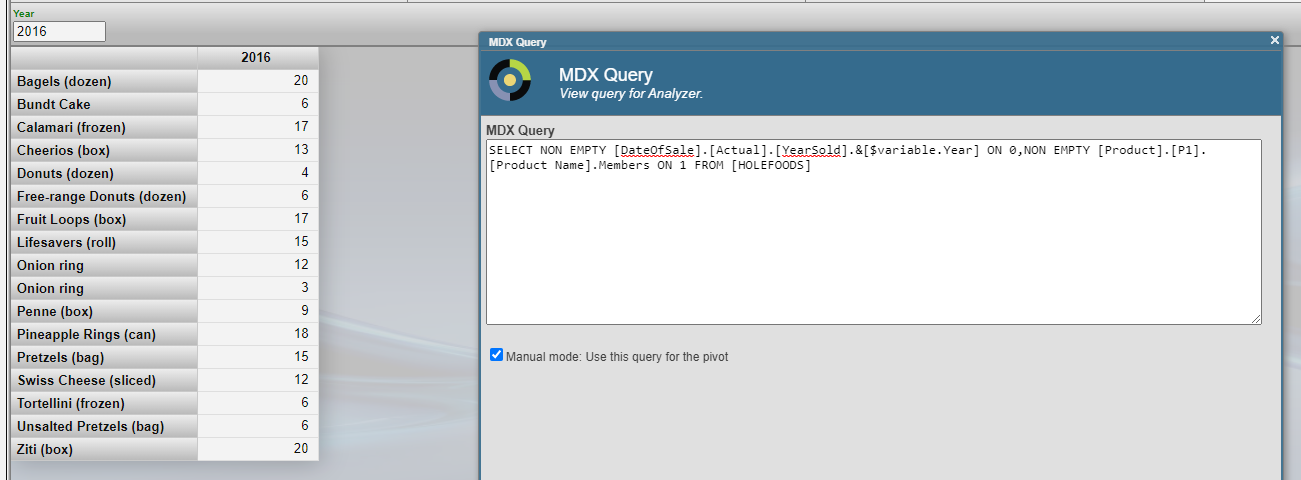
is there any API available that would return an MDX query string for a given saved pivot name? I could not find anything except for pivots with manual MDX. But that's not my case, I need to get MDX for any pivot.
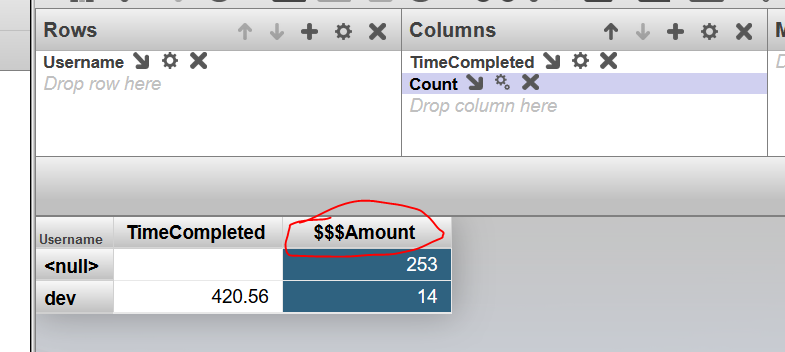
How can I create a calculated field that will give me the grand total of a column? For instance, if I have a row that has 200, 300, 500, 600, how do I get the Grand Total?
I have already used the wrench under Column Options as % of Total so, I can't use that option.
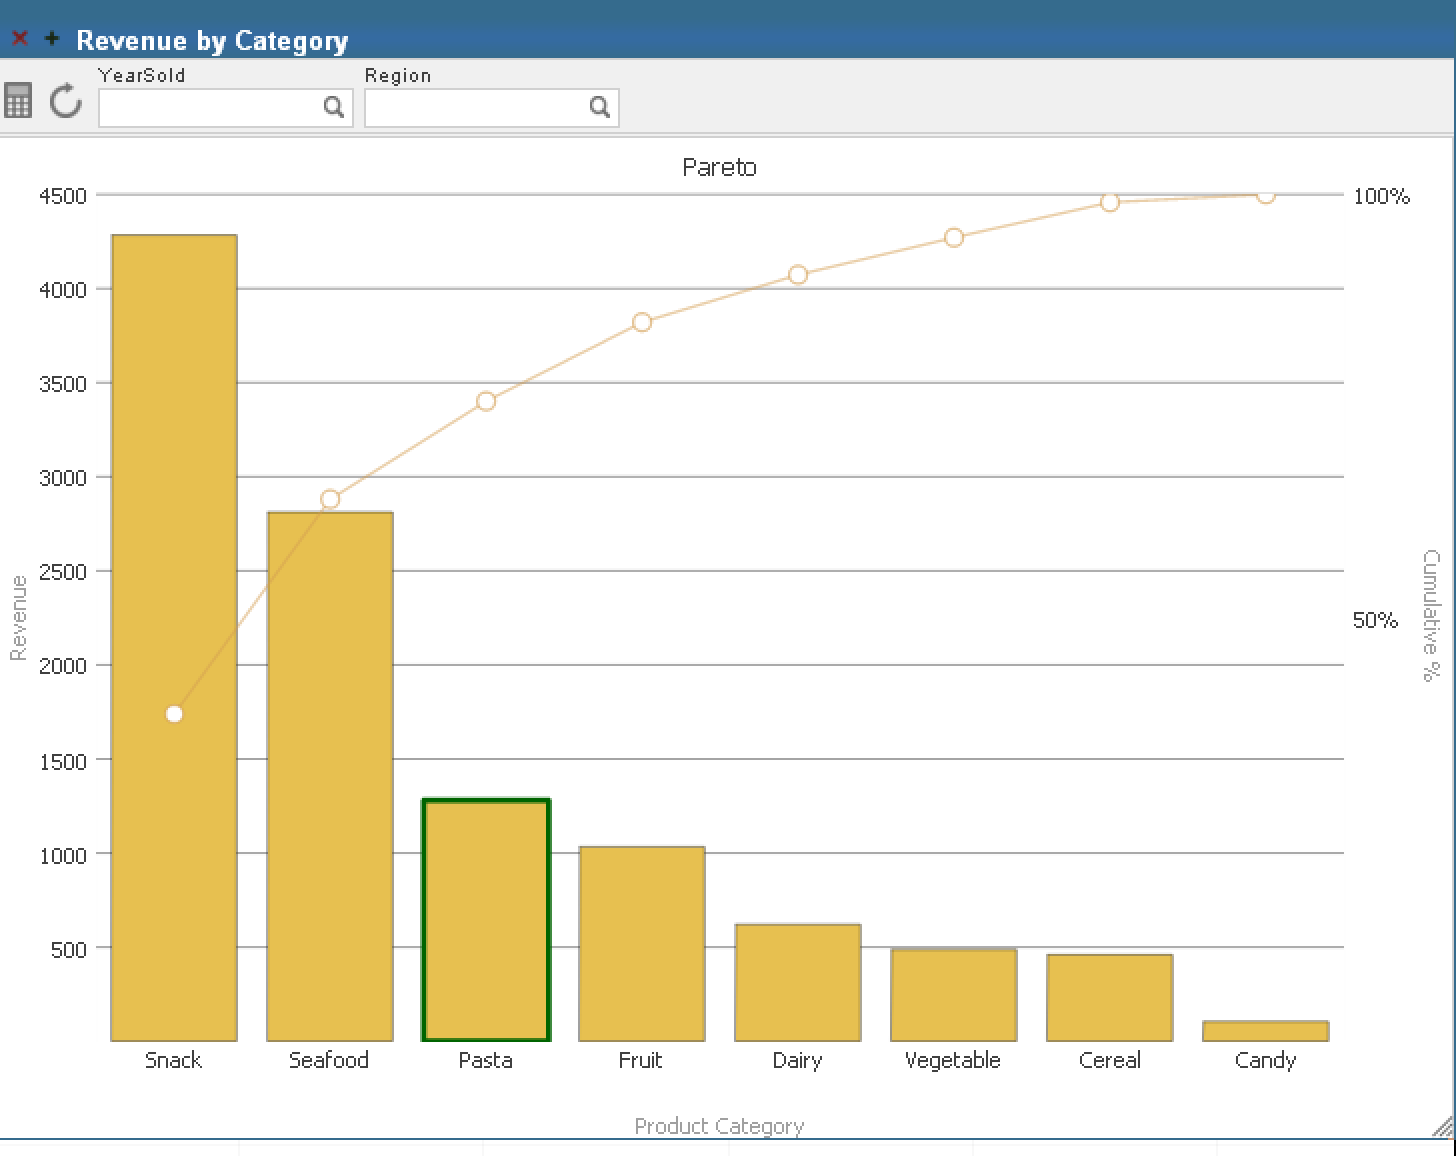
I'm stuck on how to show the top 15 payers and then also show the percentage of the total amount paid for each one. The total amount is what was paid by all the payers not just the top 15.
I built a dashboard to show hourly instrument capacities based on a term list. The term list consists of the TestInstrumentID and the number of tests that instrument can perform in 1 hour. The calculation works correctly and the data is accurate but periodically if you go to check the dashboard the percentages all get changed to 100% across every hour. If you check it later or add an additional site to the filter then the percentages correct themselves. I don't know what's causing this or how to troubleshoot it because it does calculate correctly but is not consistent.
I have a server with rusw locale but in my cube the time dimension shows dates such as "JAN-2018". Is there a way to either localize that (preferably) or just output numbers like "01-2018"?
Architect:
Analyzer:
Also in architect, in level settings there is a "Time Format" property, what's that? Tried setting it to 3 but it didn't help.
How do I best create a filter in DeepSee to restrict query results for the current login, that is where the results are filtered by a Dimension compared to the ObjectScript special variable $USERNAME or an ObjectScript expression that restricts what the current user is allowed to see?
When I export the cube and the pivots that I made and import to another environment , the calculated metrics and dimension and also de pivot variable didn´t appear in the other environment. Because of this the pivot that use these metrics show error when you try to open.
I want to know that this behavior is normal or exist a way that you can export everything, independent if you build inside the cube or inside analyzer.
To connect to AtScale, we will use the SQL Server Analysis Services database. Let's open it in the Power Query editor. To do that, select Transform Data on the Home. In the window that appears, go to the Home, expand New Source and select Analysis Services.
The question that I have , it's very simple. I developed a pivot that contains two rows, the first it's a date and the other another field. I need to orde by date in descending order and I can´t find where I can do this. I saw that it's a option Sort members, but it's based in a condition of the measures.
I am trying to create a query that returns the best and worst performing products for a given customer, based on this year's net sales versus last year's net sales, weighted by the total net sales for all of the products sold to this customer in the last two years.
I have created Last Year Net Sales (up to the last month end): AGGREGATE(PERIODSTODATE([Invoice Date].[H1].[YEAR],[Invoice Date].[H1].[Month].[NOW-13]),measures.[Net Sales])
I am building a pivot table and need help creating a calculated field for a dollar range. For instance, I am trying to create a calculated field to show account balance greater than $5k and less than $10k.
How can I create a calculated member in Analyzer using MDX for the following logic?
WHEN 'F' THEN 'FEMALE' WHEN 'Female' THEN 'FEMALE' WHEN 'M' THEN 'MALE' WHEN 'Male' THEN 'MALE' WHEN 'U' THEN UNDIFFERENTIATED' WHEN 'UN' THEN UNDIFFERENTIATED' WHEN 'Undifferentiated' THEN UNDIFFERENTIATED' ELSE 'OTHER' END
The goal is to get data (from half a thousand to 3-4 thousands lines) from DB, calculate standart deviation then use it as logical condition in analyzer.
For example IF std > custom_value = show_the_result ELSE null
There is a STDDEV(MDX) method used in Analyzer but it is a measure and it can not be used as logical condition (correct me if i am wrong)
suppose a part of my mdx query is [DIMENSION].[H1].[LEVEL1].CURRENTMEMBER.Property("PROP1").
If the source property of PROP1 is also used as a dimension level somehwere in the cube, this query will return a key to the entry in the coresponding star table.
Does anybody know how I can follow that key and display the real value value?
 By replies
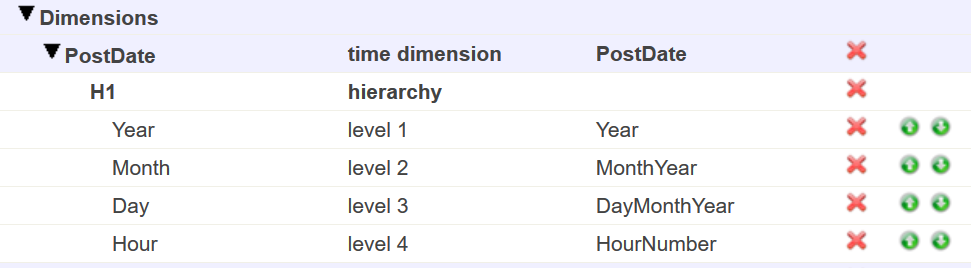


 Open Exchange app