Why log in to view pivot tables when you can have them delivered directly to your inbox? Are you in need of automated reporting for InterSystems IRIS Business Intelligence? Pivot Subscriptions is your solution: a tool for subscribing to scheduled email reports of pivot tables inside InterSystems IRIS Business Intelligence (previously known as DeepSee).

6 0
1 515

What is %SQLRESTRICT

%SQLRESTRICT is a special %FILTER clause for use in MDX queries in InterSystems IRIS Business Intelligence. Since this function begins with %, it means this is a special MDX extension created by InterSystems. It allows users to insert an SQL statement that will be used to restrict the returned records in the MDX Result Set. This SQL statement must return a set of Source Record IDs to limit the results by. Please see the documentation for more information.

Why is this useful?

This is useful because there are often times users want to restrict the results in their MDX Result Set based on information that is not in their cubes. It may be the case that this information may not make sense to be in the cube. Other times this can be useful when there is a large set of values you want to restrict. As mentioned before, this is not a standard MDX function, it was created by InterSystems to handle cases were queries were not performing well or cases that were not easily solved by existing functions.

6 0
1 598

Data Analysis

This is the sequel to Data Collection. If you have not had a chance to go through and install that you should first do that.

What is provided here is the analysis for the collection of that data that was collected earlier.

In much the same way as was done in that repository you will need to import the xml that makes up this repository.

Starting at the topmost level there is a task:

4 0
1 100

Hi guys!

I'd like to present you my new project: iris-analytics-notebook, a notebook approach to use IRIS analytics capabilities.

Project description

In past few years, notebooks tools like Jupyter are gaining popularity due its natural way to express ideias.

An almost unipresent tool for data scientists, notebook can also help to improve the impact of analytics tools for all sort of users.

2 0
0 227

Hi, Community!

Please find a new session recording from Global Summit 2017:

Optimizing SQL Queries

https://www.youtube.com/embed/nEKYDd2meDM
[This is an embedded link, but you cannot view embedded content directly on the site because you have declined the cookies necessary to access it. To view embedded content, you would need to accept all cookies in your Cookies Settings]

2 0
0 417

Preview Mode was added to InterSystems IRIS Business Intelligence to give designers a quick view of what their resulting Pivot Table will look like without needing to wait for the results to fully execute. This can be beneficial when designing pivot tables because if you are dragging and dropping elements to see how they look/work in your pivot table and seeing if they have the desired data. Since you are exploring and designing, you don't necessarily care about the results at the moment, but you would still like to see how your table looks with the changes you have made.

2 0
0 373

Hey Developers,

New video is already on InterSystems Developers YouTube channel:

Creating Pivot Tables with InterSystems IRIS Business Intelligence

https://www.youtube.com/embed/g24c8vFh2ME
[This is an embedded link, but you cannot view embedded content directly on the site because you have declined the cookies necessary to access it. To view embedded content, you would need to accept all cookies in your Cookies Settings]

1 0
0 248

This post provides further detail on the suggestions from the DeepSee Troubleshooting Guide about what to do if a user is not able to view a listing in a DeepSee cube, but instead sees errors like this:

ERROR #5540: SQLCODE: -99 Message: User <username> is not privileged for the operation [zfindStatement+118^%SQL.DynamicStatement.1:<namespace>] (8)

1 1
0 853

I want to have a generic PercentOfAll measure that can be used for any dimension of the cube. This PercentOfAll should act like Count, but instead of showing the number of rows in a cell, it will show the percentage (100*number of rows for that member/all rows) .It should not matter what dimension is being viewed. Ex

There are a total of 100 rows in the source class.

1 1
0 351

Dear Folks,

I have recently studied deepsee and developed few dashboards needed for our web app users. I am trying to embed them in our existing web app which uses angular with delegated user access. I need to embed the native IRIS dashboard into it. ( I can't use Highcharts or any other js tools).

How do I setup the dashboards to work with delegated authentication (Without providing access to management portal or other parts) ? Also should I use the default csp/{Namespace}/_DeepSee.UserPortal.DashboardViewer.zen? or any other web application URL ?

Thanks

0 1
0 191

Is there a way to add/substract from a pivot variable?

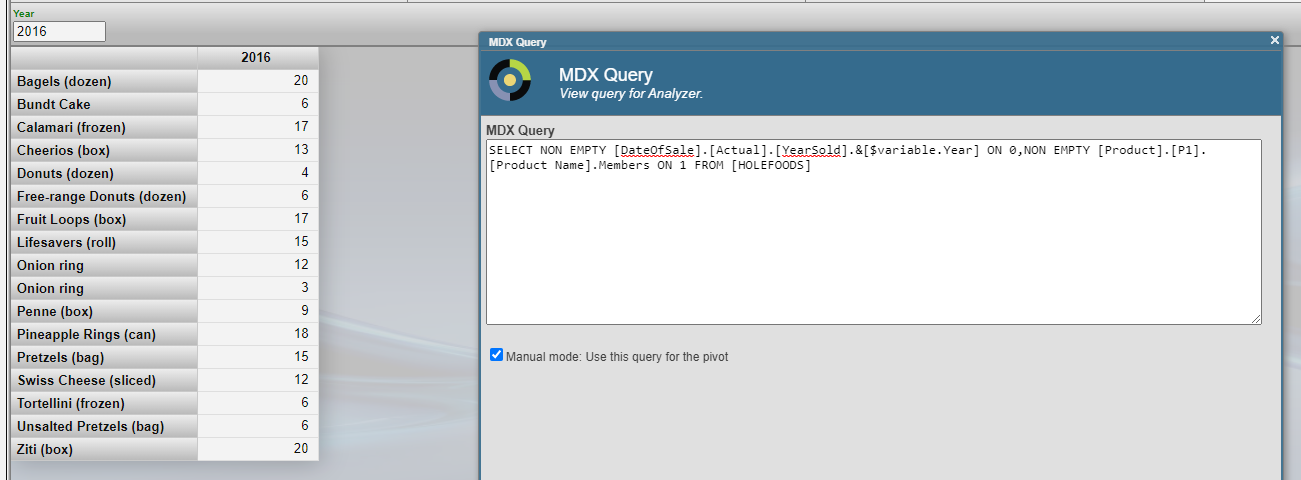
I have this MDX:

SELECT
  NON EMPTY [DateOfSale].[Actual].[YearSold].&[$variable.Year] ON 0,
  NON EMPTY [Product].[P1].[Product Name].Members ON 1
FROM [HOLEFOODS]

And with pivot variable Year equal to, say, 2016 it works:

Now I want to add previous year first with one pivot variable and one explicit reference. It also works:

0 3
0 124

Hi community,

When I export the cube and the pivots that I made and import to another environment , the calculated metrics and dimension and also de pivot variable didn´t appear in the other environment. Because of this the pivot that use these metrics show error when you try to open.

I want to know that this behavior is normal or exist a way that you can export everything, independent if you build inside the cube or inside analyzer.

Thanks.

Jaqueline Krieger

0 3
0 388
Question
· Aug 27, 2018
Order by date

Hi community,

The question that I have , it's very simple. I developed a pivot that contains two rows, the first it's a date and the other another field. I need to orde by date in descending order and I can´t find where I can do this. I saw that it's a option Sort members, but it's based in a condition of the measures.

Can someone help me with this.

Thanks in advance.

0 3
0 696