#Analyzer

3 Followers · 51 Posts

DeepSee Analyzer is a WYSIWYG editor for MDX queries which are the data sources for DeepSee interactive widgets

InterSystems staff + admins Hide everywhere
Hidden post for admin
Question Dmitrij Vladimirov · Nov 26, 2025

I use $SELECT() in Architect to aggregate various data conditions into a single dimension.

I have a data table like this: id, user, userData1, userData2...

Where each user action is the %Integer ID of that action from some source. Then in expression field i use: $SELECT(userAction1:"This user action", userAction2:"That user action".) and so on, up to 14 conditions, excluding the default placeholder 1:"Other" (which is always empty because there is a condition with 100% chance).

21
0 229
Question Steve Pisani · Oct 22, 2017

Hi,

I have a persistent class “sp.SensorReading” which has a number of Properties: Date, SensorName, SensorReading.   (sometimes multiple readings from the same sensor, on a given day)

...
Temp    28 Jan                    33.5
Temp    29 Jan                    31.2
Temp    30 Jan                    33.1
Temp    30 Jan                    34.1
Temp    31 Jan                    32.1
Temp    31 Jan                    33.1

Say I built a cube built to analyse data  from this persistent

12
0 477
Question Derrek Kegler · Mar 7, 2017

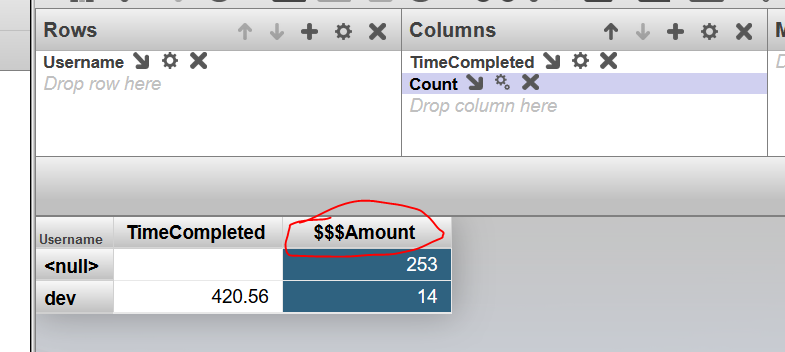
How can I create a calculated field that will give me the grand total of a column? For instance, if I have a row that has 200, 300, 500, 600, how do I get the Grand Total?

I have already used the wrench under Column Options as % of Total so, I can't use that option.

9
0 487
Question Nick Petrocelli · Nov 13, 2023

Hello all,

Currently I am trying to create a pivot table based on a cube with several calculated measures that perform a distinct member count, as in https://docs.intersystems.com/iris20231/csp/docbook/DocBook.UI.Page.cls… . However, when I add these measures as the columns of the pivot table, the resulting row generation step can take a long time (at least five minutes). This includes row generation when performing drill-downs.

6
0 285
Question Stella Ticker · Apr 13, 2019

I am building a cube based on a source class, which I  will call,  Family.Dad 

In the class definition for Family.Dad, there is a relationship, offspring  As Child  [ Cardinality = children, Inverse =  father]

In the class definition for Child, there is a relationship called father As Dad  [ Cardinality = parent, Inverse =  offspring]

In the actual data, a dad can have many children, but a child can only have 1 dad.

Using DeepSee, I am trying to analyze to answer questions such as how many dads have children called Joseph ( Ex dad.offspring.GetAt(x).Name) etc .

6
0 435
Question Mike Rowland · Jan 17, 2023

I built a dashboard to show hourly instrument capacities based on a term list. The term list consists of the TestInstrumentID and the number of tests that instrument can perform in 1 hour. The calculation works correctly and the data is accurate but periodically if you go to check the dashboard the percentages all get changed to 100% across every hour. If you check it later or add an additional site to the filter then the percentages correct themselves. I don't know what's causing this or how to troubleshoot it because it does calculate correctly but is not consistent. 

6
0 339
Question Ashok S · Nov 2, 2016

Hi All,

I need some help to create mdx for the following scenario.


My source table is like this format

FileName AuditDate FileType FileStatus AuditStatus
A 20161102 20 open 0
A 20161101 20 read 1
A 20161031 20 write 0
A 20161030 20 close 1
B 20161102 40 open 1
C 20161101 45 read 1
D 20161031 40 read 1
E 20161031 20 open 0
E 20161102 40 read 1
F 20161102 45 read 1


When the user selects any Date in my application, Till selected date results are displayed for all filename.

My current MDX is

SELECT
{
    [FileTypeD].[H1].[FileType].&[20],
    [FileTypeD].[H1].[FileType].&[40],
    [FileTypeD].[H1].[FileType].&[45]
} ON 0,
CROSSJOIN([FileStatusD].[H1].

5
0 574
Question Samuel Claiborne · Nov 9, 2016

Hello. I'm just getting started in DeepSee, and am also a newbie in MDX.

I am looking to create a pivot table that will be used to drive a bar chart. The chart will have product classes across the bottom, and two bars per class: a calculated measure to derive Net Sales for the specified period last year, and a straight aggregation of a standard measure for the same period for this year. Ideally, this period can be chosen by the user via filters on the dashboard, and it could be week, month, or quarter. So, obviously, it's the calculated field (and perhaps the entire MDX query) I need help with.

4
0 595
Question JAQUELINE KRIEGER · Aug 27, 2018

Hi community, 

 The question that I have , it's very simple. I developed a pivot that contains two rows, the first it's a date and the other another field. I need to orde by date in descending order and I can´t find where I can do this. I saw that it's a option Sort members, but it's based  in a condition of the measures. 

Can someone help me with this. 

Thanks in advance. 

3
0 852
Question Eduard Lebedyuk · Jun 4, 2021

Is there a way to add/substract from a pivot variable?

I have this MDX:

SELECT
  NON EMPTY [DateOfSale].[Actual].[YearSold].&[$variable.Year] ON 0,
  NON EMPTY [Product].[P1].[Product Name].Members ON 1
FROM [HOLEFOODS]

And with pivot variable Year equal to, say, 2016 it works:


Now I want to add previous year  first with one pivot variable and one explicit reference. It also works:

SELECT
  NON EMPTY
  {
    [DateOfSale].[Actual].[YearSold].&[$variable.Year],
    [DateOfSale].[Actual].[YearSold].&[2015]
  } ON 0,
  NON EMPTY [Product].[P1].[Product Name].
3
0 226
Question Ashok S · Nov 30, 2016

Dear All,

From my web page, i am passing filter values to mdx query.

when mdx executes, i am getting Error #5001: Invalid member expression: empty name(2).

when i try the same in samples namespace (patient cube). I got the same error.

Below is my sample MDX from patients cube.

SELECT 
NON EMPTY %KPI("PluginDemo","HighScoreCount",,"%CONTEXT") 
ON 1 
FROM [PATIENTS] 
%FILTER %OR([HOMED].[H1].[ZIP].&[32000])

Result: 0   This works fine.


SELECT 
NON EMPTY %KPI("PluginDemo","HighScoreCount",,"%CONTEXT") 
ON 1 
FROM [PATIENTS] 
%FILTER %OR([HOMED].[H1].[ZIP].&[32006])

Result: 13   This works fine.

3
0 490
Question Toni Crooz · Jul 27, 2025

Hi all,

I’m working on a data transformation in IRIS where I need to calculate the difference in hours between two timestamps stored as %TimeStamp.

Example:

Set startTime = "2024-07-12 08:30:00"
Set endTime = "2024-07-12 15:15:00"

I’d like to calculate the number of hours (with decimals, like 6.75) between them. What's the recommended way to do this in ObjectScript? I’ve seen examples using $ZDATETIME, but I’m not sure if that’s the cleanest approach.

Any suggestions or best practices would be appreciated!

Thanks,
Jhonn Marie

3
0 166
Question Samuel Claiborne · Dec 28, 2016

I am trying to create a query that returns the best and worst performing products for a given customer, based on this year's net sales versus last year's net sales, weighted by the total net sales for all of the products sold to this customer in the last two years.

I have created Last Year Net Sales (up to the last month end): AGGREGATE(PERIODSTODATE([Invoice Date].[H1].[YEAR],[Invoice Date].[H1].[Month].[NOW-13]),measures.[Net Sales])

This year Net Sales: AGGREGATE(PERIODSTODATE([Invoice Date].[H1].[YEAR],[Invoice Date].[H1].[Month].[NOW-1]),measures.

3
0 413
Question JAQUELINE KRIEGER · Mar 19, 2018

Hi community,

When I export the cube and the pivots that I made and import to another environment , the calculated metrics and dimension and also de pivot variable didn´t appear in the other environment. Because of this the pivot that use these metrics show error when you try to open. 

I want to know that this behavior is normal or exist a way that you can export everything, independent if you build inside the cube or inside analyzer.  

Thanks.

Jaqueline Krieger

3
0 468
Question Dmitrij Vladimirov · Nov 22, 2024

Hence the question: is there a way to do that?
The goal is to get data (from half a thousand to 3-4 thousands lines) from DB, calculate standart deviation  then use it as logical condition in analyzer. 
For example IF std > custom_value = show_the_result ELSE null
There is a STDDEV(MDX) method  used in Analyzer but it is a measure and it can not be used as logical condition (correct me if i am wrong)

And there is a Embedded Python with numpy, but logic behind STDDEV(MDX) and numpy.

2
0 166
Question Benjamin Bryans · Nov 21, 2016

I currently have an MDX query/calculated measure as per the below:

 
[DaysOnListRange].[H1].[DaysOnListRange].&[Days 91 - 180]+ [DaysOnListRange].[H1].[DaysOnListRange].&[Days 181 - 365]+
[DaysOnListRange].[H1].[DaysOnListRange].&[Days 365+]

however it currently doesn't sum when there is a blank in the data.
How can I amend this query to include empty cells/only sum cells with data?

I've tried using nonempty but it doesn't appear to work in this context

2
0 456
Question Dmitrij Vladimirov · Mar 25, 2025

Hi!
I have question about MDX functionality in context of IRIS Analytics.

How does IRIS MDX distinct selection works? Is there any restruqtion when analyzing strings? Like special symbols or length?
Here is an example
I have this data:
 6 rows and 2 of them unique
Then we create data cube based on this model and examine it with Analyzer
 
Detailed listing
 
6 rows an ONE unique string. Which is obviously not true. 
This happed only with string with symbols in it
My task is to get the right amount of unique strings

2
0 135
Question Eduard Lebedyuk · Jul 23, 2019

I have this fact table

CheckTime Error Marker (1 or 0)
2019-01-01 00:01:00 1 0
2019-01-01 00:02:00 5 1
2019-01-01 00:03:00 2 0


And the cube which is pretty much 1:1.

I have build an MDX:

SELECT NON EMPTY [Measures].[Error] ON 0,NON EMPTY [CheckTime].[H1].[Minute].Members ON 1 FROM [CHECKCUBE]

Which produced this chart in DeepSeeWeb (there's obviously more data, but you get an idea):

However, I want to add a Marker - if it equals 1 then I need some indication on the chart, so the graph should look like this:

Is there a way to do that in DeepSee or DeepSeeWeb?

2
0 306
Question Jacinto Busquets · Apr 6, 2023

How can I create a calculated member in Analyzer using MDX for the following logic?

WHEN 'F' THEN 'FEMALE'
WHEN 'Female' THEN 'FEMALE'
WHEN  'M' THEN 'MALE'
WHEN 'Male' THEN 'MALE'
WHEN 'U' THEN UNDIFFERENTIATED'
WHEN 'UN' THEN UNDIFFERENTIATED'
WHEN 'Undifferentiated' THEN UNDIFFERENTIATED'
ELSE 'OTHER'
END

2
0 297
Question Krishnamuthu Venkatachalam · Mar 26, 2021

Dear Folks,

I have recently studied deepsee and developed few dashboards needed for our web app users. I am trying to embed them in our existing web app which uses angular with delegated user access. I need to embed the native IRIS dashboard into it. ( I can't use Highcharts or any other js tools). 

How do I setup the dashboards to work with delegated authentication (Without providing access to management portal or other parts) ? Also should I use the default csp/{Namespace}/_DeepSee.UserPortal.DashboardViewer.zen? or any other web application URL ?

Thanks

1
0 263
Question Ephraim Malane · Jan 8, 2024

Hi Community,

I hope this message finds you well. I am reaching out because I have encountered an issue with a new dimension I created, named "Region," and I could use your assistance in resolving it.

The problem is that when I open the cube analyzer, the "Region" dimension does not populate data as expected. Instead, it merely displays the text "sourceRegion," which I specified as an expression in the architect. 

To provide a bit more context, my intention in creating this dimension was to incorporate data from the Health care facility relational table into the cube.

1
0 186