Hi Community,

Enjoy watching the new video on InterSystems Developers YouTube:

Querying 6 Terabytes of Protected Health Information at Northwell @ Global Summit 2022

https://www.youtube.com/embed/66rZCdX7m8U
[This is an embedded link, but you cannot view embedded content directly on the site because you have declined the cookies necessary to access it. To view embedded content, you would need to accept all cookies in your Cookies Settings]

1 0
1 359

Hey Community,

Click play and immerse yourself in our fresh video on InterSystems Developers YouTube:

Adaptive Analytics in Action - Two Customer Use Cases @ Global Summit 2023

https://www.youtube.com/embed/tfUcHFnL6wM
[This is an embedded link, but you cannot view embedded content directly on the site because you have declined the cookies necessary to access it. To view embedded content, you would need to accept all cookies in your Cookies Settings]

0 0
0 202

The rise of Big Data projects, real-time self-service analytics, online query services, and social networks, among others, have enabled scenarios for massive and high-performance data queries. In response to this challenge, MPP (massively parallel processing database) technology was created, and it quickly established itself. Among the open-source MPP options, Presto (https://prestodb.io/) is the best-known option. It originated in Facebook and was utilized for data analytics, but later became open-sourced.

6 0
3 232

This article contains the tutorial document for a Global Summit academy session on Text Categorization and provides a helpful starting point to learn about Text Categorization and how iKnow can help you to implement Text Categorization models. This document was originally prepared by Kerry Kirkham and Max Vershinin and should work based on the sample data provided in the SAMPLES namespace.

5 0
1 724

I was using PowerBI to create regular display data obtained from one popular web sourse with hundreds of thousands of visitors per month and a big number of users.

At the beginning of that visualisation development, I was using direct connection from Power BI to Adaptive Analytics powered by AtScale. Adaptive Analytics is useful for cached data, aggregates and fast data sources switching between development and stage phases. The “AtScale cubes'' connection method was used:

3 0
0 990

Hi Community,

Watch this video to see InterSystems IRIS in action as it is applied to real-world use cases, including business 360 and real-time analytics processing:

InterSystems IRIS Live Demos @ Global Summit 2022

https://www.youtube.com/embed/pntzJY4pgA8
[This is an embedded link, but you cannot view embedded content directly on the site because you have declined the cookies necessary to access it. To view embedded content, you would need to accept all cookies in your Cookies Settings]

0 0
0 444

Hi, Community!

This week we have two videos.

Please find the second Developer Community Video of the week on InterSystems Developers YouTube Channel:

Turning Accountants into Explorers

https://www.youtube.com/embed/2wG17vzXTy4
[This is an embedded link, but you cannot view embedded content directly on the site because you have declined the cookies necessary to access it. To view embedded content, you would need to accept all cookies in your Cookies Settings]

1 0
0 313

Hi Community,

New session recording from Global Summit 2019 is available on InterSystems Developers YouTube Channel:

The Data Management and Analytics Landscape

https://www.youtube.com/embed/wuuCQ6erMFs
[This is an embedded link, but you cannot view embedded content directly on the site because you have declined the cookies necessary to access it. To view embedded content, you would need to accept all cookies in your Cookies Settings]

1 0
0 193

Hello Community,

Thank you all for your continued feedback and support of our ad hoc reporting platform, VDM. There's been some questions around setting up a non-ODBC connection for InterSystems platforms. We published a new YouTube video showing the steps necessary to connect to InterSystems Caché and InterSystems IRIS with BridgeWorks VDM.

2 0
3 260

Now available on Open Exchange is a library of third party charts available to use within DeepSee/InterSystems IRIS BI dashboards. To start, simply download and install, select the new portlet as the widget type, then select the chart type that you desire. If you don't find the type of chart you are looking for, you can easily extend the portlet to implement your desired chart type. These new chart types can be used within existing dashboards or you can create new dashboards using them.

4 0
0 1.1K

With the improvement of living standards, people pay more and more attention to physical health. And the healthy development of children has become more and more a topic of concern for parents. The child's physical development can be reflected from the child's height and weight. Therefore, it is of great significance to predict the height and weight in a timely manner.

1 0
1 203

Hi Developers,

Watch this video to learn about some recent machine learning engagements InterSystems is driving, including TrakCare predictive analytics and examples from our Developer Community and partners:

Artificial Intelligence Healthcare Solutions - Time to Take Action @ Global Summit 2023

https://www.youtube.com/embed/Xminu9GmwEc
[This is an embedded link, but you cannot view embedded content directly on the site because you have declined the cookies necessary to access it. To view embedded content, you would need to accept all cookies in your Cookies Settings]

0 0
0 247

Hi Community,

This week we have two new videos from Global Summit 2019. Please welcome:

1. An ML Toolkit for InterSystems IRIS: Co-Innovation in Healthcare

https://www.youtube.com/embed/o0T0AgvxaNk
[This is an embedded link, but you cannot view embedded content directly on the site because you have declined the cookies necessary to access it. To view embedded content, you would need to accept all cookies in your Cookies Settings]

0 0
0 319

Preview Mode was added to InterSystems IRIS Business Intelligence to give designers a quick view of what their resulting Pivot Table will look like without needing to wait for the results to fully execute. This can be beneficial when designing pivot tables because if you are dragging and dropping elements to see how they look/work in your pivot table and seeing if they have the desired data. Since you are exploring and designing, you don't necessarily care about the results at the moment, but you would still like to see how your table looks with the changes you have made.

2 0
0 393
Article
· Nov 20, 2020 2m read
Enrich your analytics projects with NLP

According IDC, 80% of all data produced are NoSQL. See:

There are digital documents, scanned documents, online and offline texts, blob content into SQL, images, videos and audio. Imagine a Corporate Analytics initiative without all these data to analyze and support decisions?

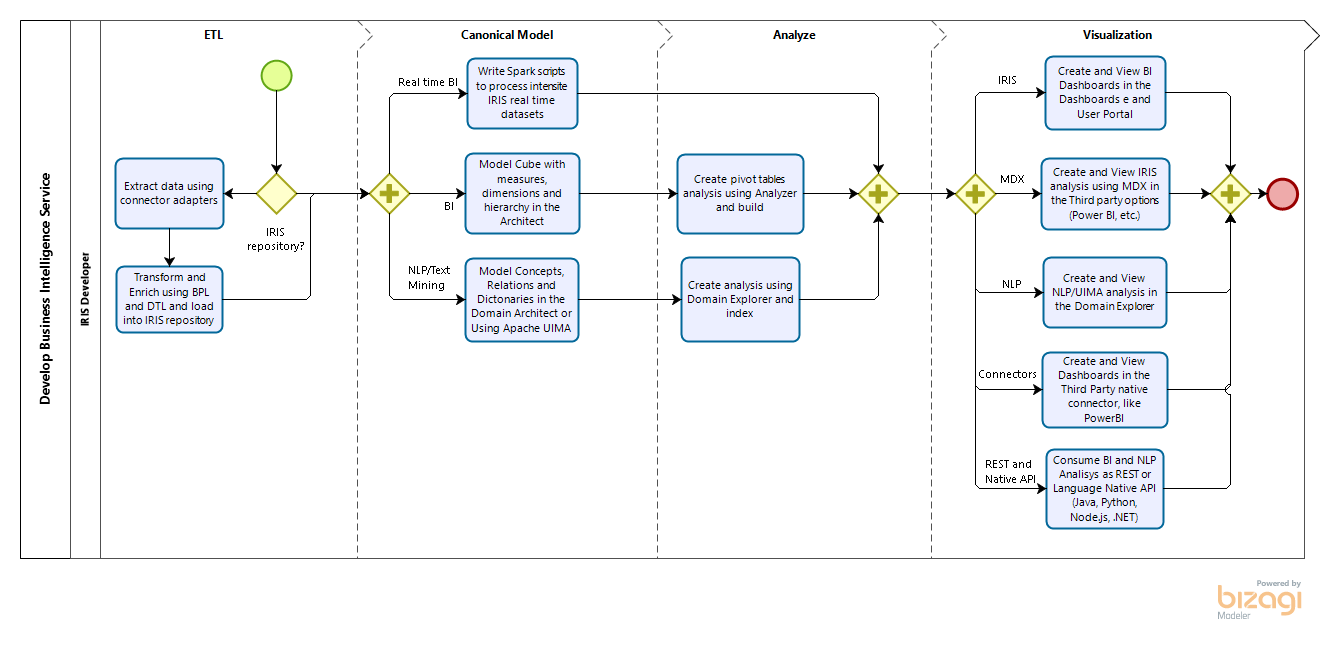
In all the world, many projects are using techonologies to transform these NoSQL data into textual content, to allows analyze it. See:

2 0
2 289

The release of InterSystems IRIS 2021.1 introduces Adaptive Analytics. To get started with a familiar InterSystems IRIS BI sample cube, we have created a HoleFoods Sample Application for Adaptive Analytics. This Sample Application is available on Open Exchange. There is also a learning services course available to learn more about Adaptive Analytics.

3 0
0 267

Hi Community,

Enjoy watching the new video on InterSystems Developers YouTube:

iKnow: Open Source NLP in InterSystems IRIS

https://www.youtube.com/embed/n-TL_Wh7Tv4
[This is an embedded link, but you cannot view embedded content directly on the site because you have declined the cookies necessary to access it. To view embedded content, you would need to accept all cookies in your Cookies Settings]

2 0
1 325

Hey Developers,

New video is already on InterSystems Developers YouTube channel:

InterSystems HealthShare Analytics Solution: Create & Deliver Real-Time Insight at Scale

https://www.youtube.com/embed/PbSKedG25eA
[This is an embedded link, but you cannot view embedded content directly on the site because you have declined the cookies necessary to access it. To view embedded content, you would need to accept all cookies in your Cookies Settings]

0 0
0 351

Today we will talk about Adaptive Analytics. This is a system that allows you to receive data from various sources with a relativistic data structure and create OLAP cubes based on this data. This system also provides the ability to filter and aggregate data and has mechanisms to speed up the work of analytical queries.

6 0
1 718

Hi Developers!

This is an anniversary announcement to celebrate 6,000 members on InterSystems Developers!

There are some other good figures came:

  • we have more than 5,000 posts with almost 1,000 articles. (956 to the moment).
  • Also, we are close to having 20,000 answers and comments and 2,000,000 reads for DC postings.

And we have the Spanish Community for 2 months running! Join Spanish DC!

4 0
1 263
Article
· Mar 2, 2020 2m read
SQL -99 error while viewing a listing

This error is sometimes seen while viewing a listing in InterSystems IRIS Business Intelligence:
ERROR #5540: SQLCODE: -99 Message: User <USERNAME> is not privileged for the operation (4)

As the error suggests, this is due to a permission error. To figure out which permissions are missing/needed, we can take a look at the SQL query that is generated. We will use a query from SAMPLES as an example.

1 0
0 1.1K

Hi Community!

New video is already on InterSystems Developers YouTube Channel:

Leveraging an Open Analytics Platform

https://www.youtube.com/embed/Vv3ENnaF2fE
[This is an embedded link, but you cannot view embedded content directly on the site because you have declined the cookies necessary to access it. To view embedded content, you would need to accept all cookies in your Cookies Settings]

1 0
0 298

Hey Developers,

See how you can use InterSystems IRIS and Alteryx together to provide analytics and insights to your users.

Using InterSystems IRIS and Alteryx

https://www.youtube.com/embed/l89QxOytjEk
[This is an embedded link, but you cannot view embedded content directly on the site because you have declined the cookies necessary to access it. To view embedded content, you would need to accept all cookies in your Cookies Settings]

3 0
0 227
Article
· Nov 15, 2022 6m read
How to develop in Logi

Today we will talk about InterSystems Reports. This is a BI system that provides you with tools to create static reports and export them to different file formats. We will see how it works using the DC Analytics public analytical sample as an example. In this article, we will examine how to familiarize yourself with the reports available in the repository, how to make a new report based on a ready-made data structure, and how to prepare a data structure from scratch.

3 0
0 699