This tag relates to the discussions on the development of analytics and business intelligence solutions, visualization, KPI and other business metrics management.
I have a series of data organized by time (year and month) so I can use a time dimension to drill down data. So far so good.
However, I need to display the data not by calendar years and months but rather by seasons. The season has 12 calendar months but starts in September. So I'd like to see the data from September / Year N to August / Year N+1 using the same hierarchy as normal time dimension.
Has anyone done something similar?
Obviously, the season can start by any month, not only September :)
I work on an ERP system and am trying to set up a dashboard according to a customer request. It's a pivot table with a few controls and filters, nothing too difficult, but I'm having some issues with drill down.
Our team has had success creating and publishing Power BI reports using an ODBC connection to an IRIS database, but there have been concerns about the responsiveness of these reports.
As an attempt to improve responsiveness, I'm trying out the "DirectQuery" connection using the InterSystems IRIS connector available in our version of Power BI Desktop (September 2021).
The version of IRIS I'm connecting with is "IRIS for Windows (x86-64) 2022.2"
My group and I are currently doing a research project on natural language processing and iKnow plays a big role in this project. I am aware that the algorithms iKnow use aren't public, and I respect that.
My question is, are there any public documents/research that explains, at least part of, the algorthims iKnow uses and the motivations for using them?
I am receiving Mirroring updates to an IRIS for Health async reporting server and need to pause the mirroring journal processing to periodically quiesce the database to rebuild cubes and custom staging tables.
What API or web service can I use to quiesce the reporting server and then later initiate catch up?
Hi, I'm new to the Analytics world in Intersystems and was attempting to print and/or export selected rows from a detail listing in a pivot on a dashboard. I am able to print and/or export all the rows; but if I select a specific set of rows, it prints out the entire detail listing; not the selected rows. Please advise on the best approach to accomplish this task. Thanks.
I have a method like this and I want to be able to see the results on the terminal, how do I run this method on a terminal to display the results of this SQL query?
The goal is to get data (from half a thousand to 3-4 thousands lines) from DB, calculate standart deviation then use it as logical condition in analyzer.
For example IF std > custom_value = show_the_result ELSE null
There is a STDDEV(MDX) method used in Analyzer but it is a measure and it can not be used as logical condition (correct me if i am wrong)
we are wondering if anybody has a reporting tool that is capable using IRIS Objects?
I know there are things like Crystal Reports and others out there who can read the SQL Data throug ODBC but we need the capability of using object methods while running the report.
Since now we where using a JAVA based report generator (ReportWeaver) but since the object binding for JAVA doesn't exist anymore in IRIS data platform, did any of you have an alternative report generator?
When creating pivots in DeepSee, there is the ability to group date dimensions by Day, Week, Month, Quarter, Year. For some of our reporting the Week option is desired. However the display looks like the image shown below. Notice the "YYYYW##" formatting.
Is there any ability within DeepSee to modify the display of grouped week dates? E.g. instead of 2020W14 it could be 03/30/2020-04/05-2020, or even just the start or end date, etc.
I would like to define an advanced filter within my pivot table that allows me to look at diagnosis codes, or at procedure codes - but I do not want to hard code values within the pivot table definition (get the %OR defined).
I would like to be able to allow my dashboard user to chose what specific diagnosis codes or procedure codes they are interested in. So for example one user may want to look for # of patients with cancer dx or patients who have had a radiation procedure.
How can I accomplish this OR feature using dashboard filters?
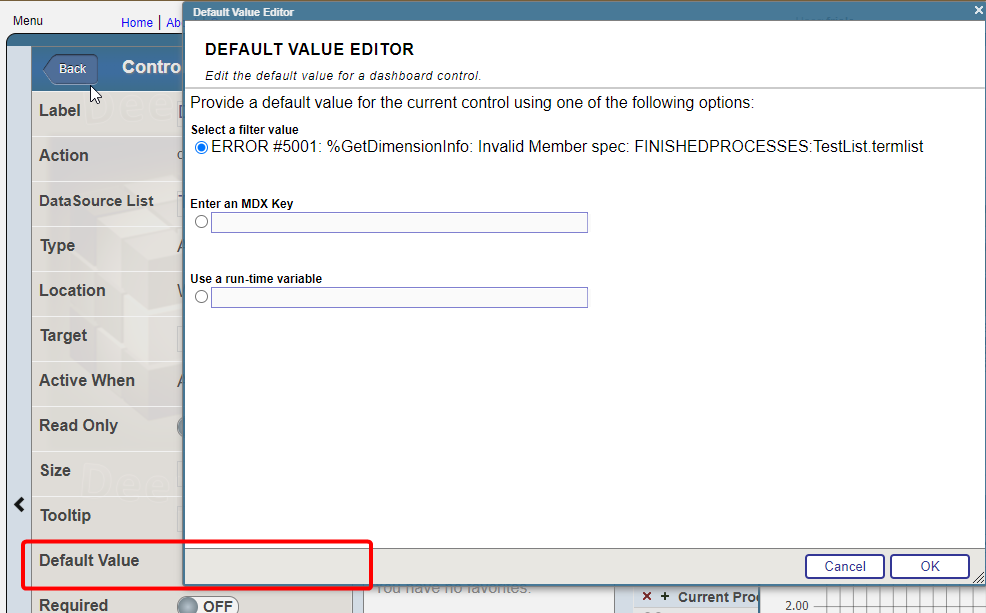
I have a widget that uses "choose Data source" control option. Termlist for the control consist of the two data sources and i want to set one of them by default. For example: I have two data sources, one is grouped by month, the other by year. I need to set the one that is grouped by year by default
The >/</= etc. operands in named filters are great... except they won't work with measures ('native' or calculated - and what a boon it would be if they could work with both).
Are there any plans to add this capability?
And are there any plans to have a 'named filter' control within widgets that would let you change the operand?
I have a pvot table defined. that generates a set of data. I want. to. execute the pivot table programatically which I believe involves using %DeepSee.ResultSet. Does someone have an example showing how to apply filters to the results?
For. example
[DateTime of Filing].[Date].[Date Filed Year] = &[2023]
We have created a custom SDA container to store a certain kind of new, customized patient data.
We are observing a behavior in the correspoding analytics table for this custom SDA class where rows are added for a patient for which the MPI is null and the patient record does not exist.
I have an SDA feed from an Edge server that eventually is fed into HSHI / Analytics. This edge server is loading up patient demographics (in the Patient object), which feeds the HSAA.Patient table in HSHI / Analytics.
However, we have other edge servers also feeding into the same HSHI database, and these other edge servers have better demographic information.
i'm trying to extend both the MemberEnrollment and the MedicalClaim objects in HS. The CareProvider is perfect for some of my extensions (Operating provider, referring provider, third-party insurer), but the documentation says https://docs.intersystems.com/irisforhealthlatest/csp/docbook/DocBook.UI...
I have 3 simple tables: Encounter, Patient and Immunizations. Encounter makes a reference to Patient, and Patient contains a list of Immunization objects.
I've tried using PowerBI to access IRIS (using ODBC connector, not InterSystems BI connector), PowerBI reports the error:
Expression.Error: The column 'Patient' of the table wasn't found.
Details:
    Patient
it does this for two of the three tables I need only (Patient and Encounter), but not for Immunization IRIS table..
 By replies
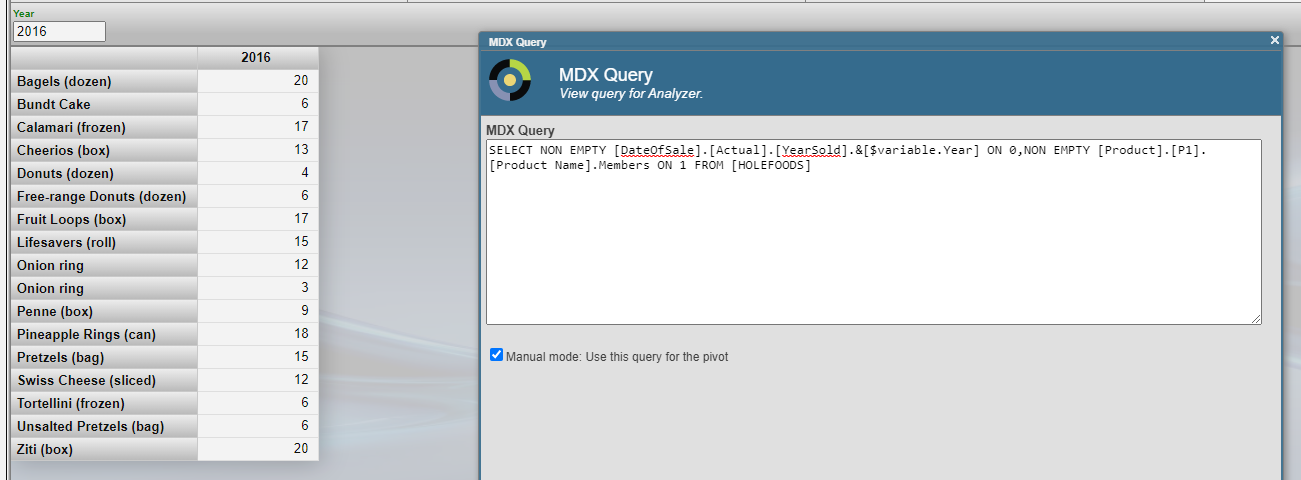
.png)
.png)