This tag relates to the discussions on the development of analytics and business intelligence solutions, visualization, KPI and other business metrics management.
https://www.youtube.com/embed/ZGYIdCTEqoQ [This is an embedded link, but you cannot view embedded content directly on the site because you have declined the cookies necessary to access it. To view embedded content, you would need to accept all cookies in your Cookies Settings]
Users of analytical applications often need to generate and send out PDF reports comprised of elements of the analytical panel. In the InterSystems stack, this task is solved using the DSW Reports project that is an extension of DeepSeeWeb. In this article, we will explain how to use DSW Reports for generating PDF reports and emailing them.
https://www.youtube.com/embed/E3o87dMxamE [This is an embedded link, but you cannot view embedded content directly on the site because you have declined the cookies necessary to access it. To view embedded content, you would need to accept all cookies in your Cookies Settings]
System Monitor is a flexible and highly configurable tool supplied with Caché (Ensemble, HealthShare), which collects the essential metrics of the operating system and Caché itself. System Monitor also notifies administrators about issues with Caché and the operating system, when one or several parameters reach the admin-defined thresholds.
https://www.youtube.com/embed/2wG17vzXTy4 [This is an embedded link, but you cannot view embedded content directly on the site because you have declined the cookies necessary to access it. To view embedded content, you would need to accept all cookies in your Cookies Settings]
I have a series of data organized by time (year and month) so I can use a time dimension to drill down data. So far so good.
However, I need to display the data not by calendar years and months but rather by seasons. The season has 12 calendar months but starts in September. So I'd like to see the data from September / Year N to August / Year N+1 using the same hierarchy as normal time dimension.
Has anyone done something similar?
Obviously, the season can start by any month, not only September :)
My group and I are currently doing a research project on natural language processing and iKnow plays a big role in this project. I am aware that the algorithms iKnow use aren't public, and I respect that.
My question is, are there any public documents/research that explains, at least part of, the algorthims iKnow uses and the motivations for using them?
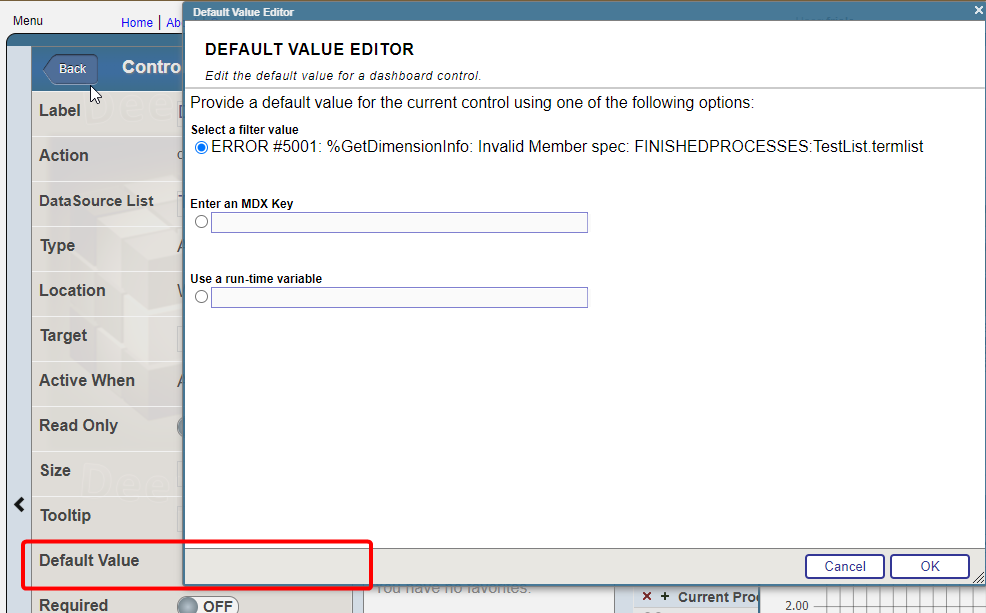
I have a widget that uses "choose Data source" control option. Termlist for the control consist of the two data sources and i want to set one of them by default. For example: I have two data sources, one is grouped by month, the other by year. I need to set the one that is grouped by year by default
https://www.youtube.com/embed/A4qAbMMQMaA [This is an embedded link, but you cannot view embedded content directly on the site because you have declined the cookies necessary to access it. To view embedded content, you would need to accept all cookies in your Cookies Settings]
https://www.youtube.com/embed/BY-l9RLzmFQ [This is an embedded link, but you cannot view embedded content directly on the site because you have declined the cookies necessary to access it. To view embedded content, you would need to accept all cookies in your Cookies Settings]
The goal is to get data (from half a thousand to 3-4 thousands lines) from DB, calculate standart deviation then use it as logical condition in analyzer.
For example IF std > custom_value = show_the_result ELSE null
There is a STDDEV(MDX) method used in Analyzer but it is a measure and it can not be used as logical condition (correct me if i am wrong)
Hi, I'm new to the Analytics world in Intersystems and was attempting to print and/or export selected rows from a detail listing in a pivot on a dashboard. I am able to print and/or export all the rows; but if I select a specific set of rows, it prints out the entire detail listing; not the selected rows. Please advise on the best approach to accomplish this task. Thanks.
I am excited to share that the Learning Services team has recently added new content to our InterSystems Reports Learning Path. These latest videos, created by our partner, insightsoftware, provide instruction for developing reports with InterSystems Report Designer.
I hope this message finds you well. I am reaching out because I have encountered an issue with a new dimension I created, named "Region," and I could use your assistance in resolving it.
The problem is that when I open the cube analyzer, the "Region" dimension does not populate data as expected. Instead, it merely displays the text "sourceRegion," which I specified as an expression in the architect.
Watch this video to learn about some recent machine learning engagements InterSystems is driving, including TrakCare predictive analytics and examples from our Developer Community and partners:
https://www.youtube.com/embed/Xminu9GmwEc [This is an embedded link, but you cannot view embedded content directly on the site because you have declined the cookies necessary to access it. To view embedded content, you would need to accept all cookies in your Cookies Settings]
https://www.youtube.com/embed/tfUcHFnL6wM [This is an embedded link, but you cannot view embedded content directly on the site because you have declined the cookies necessary to access it. To view embedded content, you would need to accept all cookies in your Cookies Settings]
Hello community, I need to solve a complex but trivial issue.
Given:
Two tables "Comment" and "Post". Each one contains an "Author" field, which is essentially a user ID. In these tables, each user ID represents an author. The goal is to count all participants together and then group them by month, language, and other metrics.
The question is how to do this within the IRIS ecosystem. Is it even possible to take two tables, get distinct data from them and then combine into one cube?
I'm trying to build a cube based on a linked table but seems that IRIS is not able to do it :O
Long story short, I have a linked table in IRIS that sources a Microsoft SQL table (using standard linked feature from the portal). It works fine, I can access it using SQL as many other times. On top of that, I've created in DeepSee (ok, Analytics) a cube that uses this class as source. It compiles correctly, no errors given. When I build it with 100 records, all goes well and using Analyzer I can see results.
Our team has had success creating and publishing Power BI reports using an ODBC connection to an IRIS database, but there have been concerns about the responsiveness of these reports.
As an attempt to improve responsiveness, I'm trying out the "DirectQuery" connection using the InterSystems IRIS connector available in our version of Power BI Desktop (September 2021).
The version of IRIS I'm connecting with is "IRIS for Windows (x86-64) 2022.2"
Watch this video to see InterSystems IRIS in action as it is applied to real-world use cases, including business 360 and real-time analytics processing:
https://www.youtube.com/embed/pntzJY4pgA8 [This is an embedded link, but you cannot view embedded content directly on the site because you have declined the cookies necessary to access it. To view embedded content, you would need to accept all cookies in your Cookies Settings]
I built a dashboard to show hourly instrument capacities based on a term list. The term list consists of the TestInstrumentID and the number of tests that instrument can perform in 1 hour. The calculation works correctly and the data is accurate but periodically if you go to check the dashboard the percentages all get changed to 100% across every hour. If you check it later or add an additional site to the filter then the percentages correct themselves. I don't know what's causing this or how to troubleshoot it because it does calculate correctly but is not consistent.
 By update
.png)
.png)