This post provides guidelines for configuration, system sizing and capacity planning when deploying Caché 2015 and later on a VMware ESXi 5.5 and later environment.
One of my colleagues had developed an interface in Health Connect (HealthShare 2019.1) to add large amounts of data to an external SQL Server database. The data comes from many text files with delimited rows and data for one table per file. There is a business process to read a file line by line and send an Insert Request to an operation.
On local environment, calling Foo() is instantaneous (a few ms). On production/test servers (which have much better hardware than local) calling this function is slow and take between 200 ms to 800 ms. Obviously starting a new job with "job" command take lot of time on those environments.
I would like to know if an encrypted caché database can run significantly slower than a normal "unencrypted" database, in a way that is noticeable to the end user (e.g. slower response time for most pages, especially the ones that rely on read/writing to globals).
I searched in Intersystems knowledge base and couldn't find anything related. I'm looking for possible before/after benchmarks.
Like hardware hosts, virtual hosts in public and private clouds can develop resource bottlenecks as workloads increase. If you are using and managing InterSystems IRIS instances deployed in public or private clouds, you may have encountered a situation in which addressing performance or other issues requires increasing the capacity of an instance's host (that is, vertically scaling).
Some time ago, I changed the configuration in SQL Runtime Statistic to "Turn on Stats code generation to gather stats at the Open and Close of a query". With this change, the CACHE base (cache/mgr/cache/) has grown a lot to reach 198GB.
Yesterday, I returned the configuration of SQL Runtime Statistic to the default which is "Turn off Stats code generation" and the cache base is no longer growing.
We are seeing more and more customers being lured with latest infrastructure technologies, particularly Composable Infrastructure. Coming with all sorts of data center consolidations and costs savings.
Question is: are there any concerns for HealthShare/TrakCare being run on these platforms or things to look out for? Anyone out there, already on these platforms?
To be more specific this is HPe Synergy with 480 Compute blades booting as bare metal.
Want to perform SNMP performance monitoring of cache2010 on AIX 5.3. Since the SNMP service that comes with AIX does not support agentX, it cannot extend the support for cache database. Therefore, I plan to deploy net-snmp on AIX first, then enable agentX, and finally configure cache's subagent. Is this workable? Any documents? Thx!
InterSystems has recently completed a performance and scalability benchmark of IRIS for Health 2020.1, focusing on HL7 version 2 interoperability. This article describes the observed throughput for various workloads, and also provides general configuration and sizing guidelines for systems where IRIS for Health is used as an interoperability engine for HL7v2 messaging.
This tool is used to generate random read Input/Output (IO) from within the database. The goal of this tool is to drive as many jobs as possible to achieve target IOPS and ensure acceptable disk response times are sustained. Results gathered from the IO tests will vary from configuration to configuration based on the IO sub-system. Before running these tests ensure corresponding operating system and storage level monitoring are configured to capture IO performance metrics for later analysis.
Enhance Ensemble or IRIS production so it can dynamically allocate pool size for adapter-based components based on their utilization.
Sometimes, an unexpected traffic volume occurs, and default pool size allocated to production components may become a bottleneck. To avoid such situations, I created a demonstrator project some 2 years ago to see, whether it would be possible and feasible to modify production, so it allowed for dynamically modifying its components per their load.
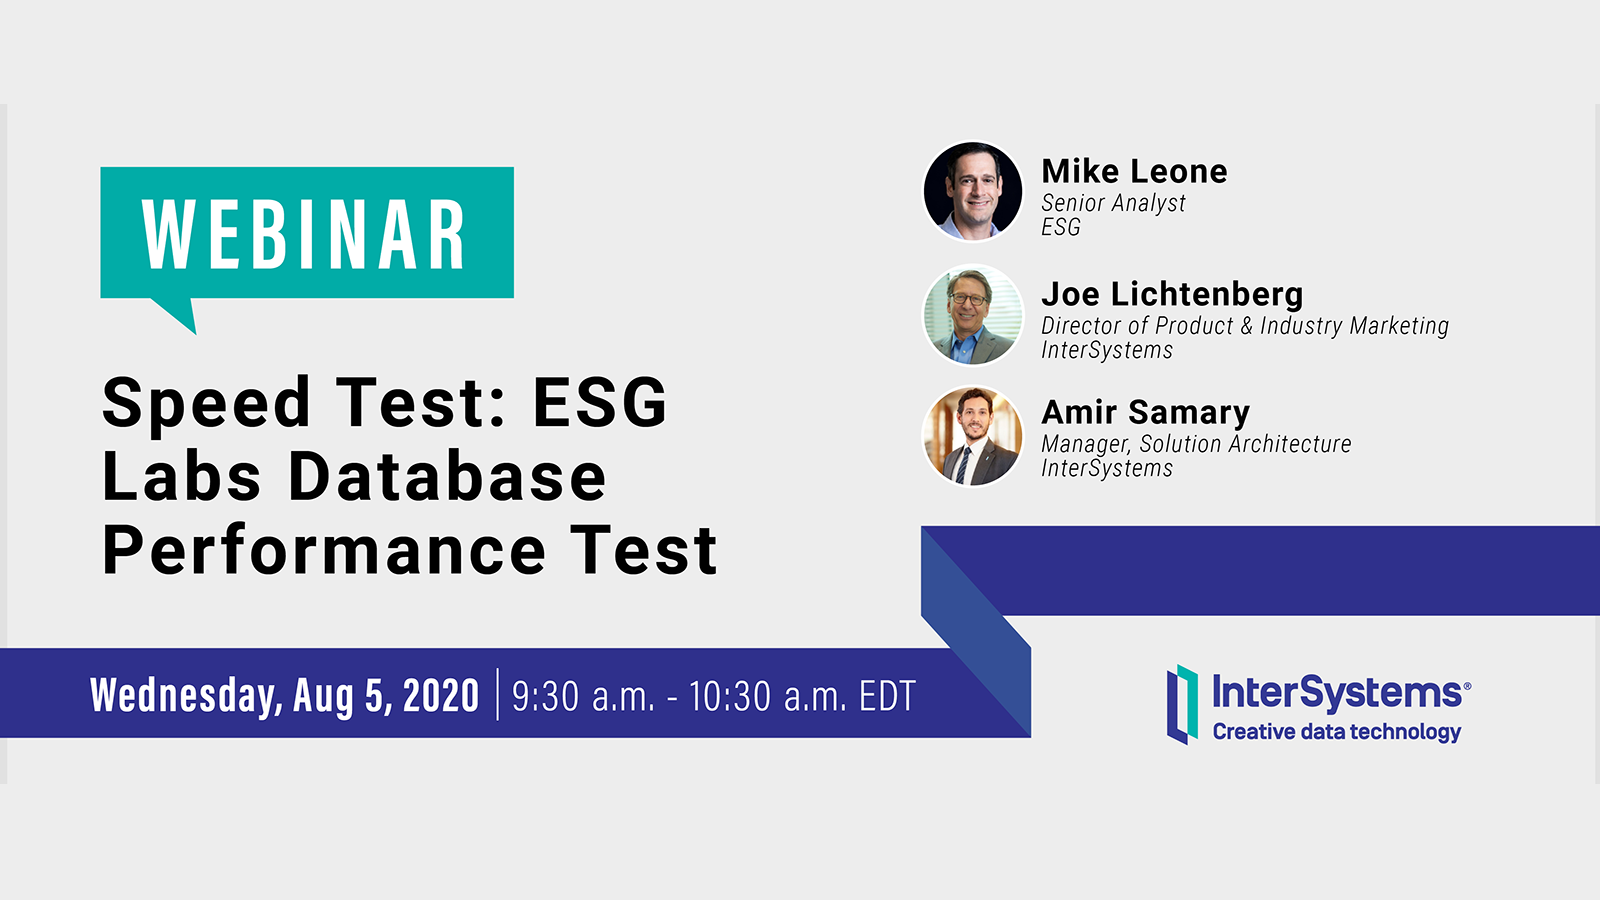
Join our live webinar with Mike Leone, senior analyst with Enterprise Strategy Group’s Validation Services, to learn about a speed test that measures and compares the concurrent real-time data ingest and query performance of InterSystems IRIS® data platform, a leading in-memory database, a cloud relational database, and a traditional relational database.
Running cache 5.0.21 64 bit on Windows server 2016 in virtual environment. Trying to understand why every single process disk read speed (simple sql data walks) caps around ~20MB/s, however 2 paralell such tasks on different data areas can reach 19MB/s each, four - 17MB/s each, that is 70MB/s total, etc. Also simple copy file to nul on that system reach ~400MB/s.
What can keep single query on idle system from reaching for example 200MB/s? Virtualization? Windows? Cache? Processors are below 1-3%
AWS has officially released their second-generation Arm-based Graviton2 processors and associated Amazon EC2 M6g instance type, which boasts up to 40% better price performance over current generation Intel Xeon based M5 instances.
A few months ago, InterSystems participated in the M6g preview program, and we ran a few benchmarks with InterSystems IRIS that showed compelling results. This led us to support ARM64 architectures for the first time.
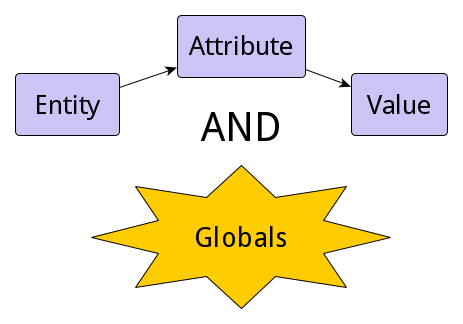
In the first article in this series, we looked at the entity–attribute–value (EAV) model in relational databases, and took a look at the pros and cons of storing those entities, attributes and values in tables. We learned that, despite the benefits of this approach in terms of flexibility, there are some real disadvantages, in particular a basic mismatch between the logical structure of the data and its physical storage, which causes various difficulties.
In the first article in this series, we’ll take a look at the entity–attribute–value (EAV) model in relational databases to see how it’s used and what it’s good for. Then we'll compare the EAV model concepts to globals.
A long time ago I enabled Activity Monitoring to be able to save myself headaches in the future when looking at the performance of various message routes through our productions. It's served it's purpose of answering questions on how many messages we process a week etc but I had not had the chance to really dig down into the stats for specific message types or destinations to pin point issues.
https://www.youtube.com/embed/4k9Qsc_HW7g [This is an embedded link, but you cannot view embedded content directly on the site because you have declined the cookies necessary to access it. To view embedded content, you would need to accept all cookies in your Cookies Settings]
https://www.youtube.com/embed/e3txoPRzK_Q [This is an embedded link, but you cannot view embedded content directly on the site because you have declined the cookies necessary to access it. To view embedded content, you would need to accept all cookies in your Cookies Settings]
 By update
 Open Exchange app