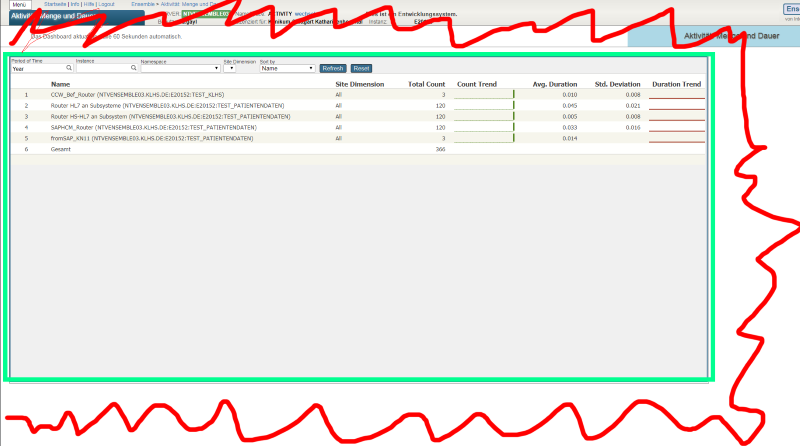
Hi I would like to follow any change made in the production IE - date,time, user,production,service/process/operation - name, item changed, value before change, value after change. Is there a way I can get this data & trap the act of change in order to log this data. Thanks Simcha
Since most of our customers moved to Caché 2015.1, some admins became abused with CPUPct warnings (sometimes alerts) in console log without other signs of lacking CPU power. Documentation states that:
I know there's a whole chapter on the subject but I would love a super simple video demo or sample configuration or training course. The myriad menu of options and unfamiliar prompts can make it a bit daunting. The challenge is simple. Send an email notification if the license usage exceeds n% LU consumption. Why? A recent software change seemed to be responsible for causing the LU total consumption to reach 100%.
Can someone direct me to where in the documentation we can find how consumption may be calculated for global storage?
Caché Version
2010.1
Operating System
HP OpenVMS 8.4
EDIT: After receiving some responses, it seems I was unclear in my initial inquiry. I am looking to determine our rate of consumption of storage; however, I am having some difficulty in doing that.
My group needs to be able to monitor items / tasks, and let a non-management-portal user see the monitoring. Is it possible to run DeepSee queries on Production items? I feel like I should not be recreating the production environment or the task manager just so that I can query on the items that are running, and on their states (like "successful" or "send email").
Also, I need to log custom events for each task, and I'm running into difficulties with the task manager in this regard; hence the question about using the Production instead, but querying it.
Internally we use splunk for monitoring applications and network.
Does Ensemble have a way of exposing internal metrics and/or a way of exposing custom built metrics?
I've used Deepsee dashboards in the past to monitor Apache Tomcat/Apache Camel/hawtio using JMX rest calls. This is the other way around and ideally I'd like to expose metrics on:
Can Cache Monitor (^MONMGR) and System Monitor be configured to also send 'OK' messages? With the first bad email, you still wonder if things are still broken, when in-fact normalcy has been restored, some even within some seconds.
As per the documentation of QueueCountAlert: Number of messages on this item's queue needed to trigger an Alert message to be sent. Note that no further alerts will be sent unless the number of messages on the queue drops below 80% of this number and then rises again to this number. Note that this alert will be sent even if AlertOnError is False. Zero means no alerts of this type will be sent.
Now, the question is, If QueueCountAlert is set to 10, and the queue size become 11 we will be getting email once.
When we write unit test cases for cache object script code using %UnitTest.TestCase, what is the best way to write code to identify code coverage?
So, let say my unit test case hit all 10 lines of code of a method for a given class. So, unit test coverage should be 100% for that. But, using line-by-line coverage [(%Monitor.System.LineByLine] getting wrong percentage, because it also includes code comment/documentation as part of code. So, practically we can not ever achieve 100% of code coverage by using this API.
At the Global Summit several folks had mention that they developed their own production monitor. I am looking to create a monitor similar to eGate that we only display those Services/Processes/Operations that are in trouble, and those Errors that are showing up in the Event Log. Does anyone have any examples of this?
We have multiple implementations spanning many namespaces and edges. I would like to see if I could identify a single place, perhaps on HSREGISTRY or HSBUS, that I could capture certain events like searches (from all customers) and record transfers (with requester and provider).
The goal is to have a dashboard that would show simple stats such as searches by participant, records shared by participant and records consumed by participant. These are the 3 most important.
I appreciated the feedback on the other question of "how" but now I'm hoping to find the "Where".