Article
· Dec 31, 2019 3m read
Portlets that use data from DeepSee


In the previous part of this series, we saw how to reference a web page that will enhance our dashboard experience. Now we will look into referencing data that is already in our cubes.

In this example, we will be referencing the controller object and we will be extracting data from it. This data will then be displayed as text in our Dashboard. In Part 5, we will show how to incorporate this data into other charting libraries.

2 0
0 267
Article
· Sep 9, 2022 1m read
DC Analytics Open Application

InterSystems Developer Community analytics. Project made with InterSystems IRIS BI (DeepSee), Power BI and Logi Report Designer to visualize and analyze members, articles, questions, answers, views and other pieces of content and activity on InterSystems Developer Community.

You can see your own activity, articles and questions. Track how your contribution changes developer community.

2 0
0 300

What is %SQLRESTRICT

%SQLRESTRICT is a special %FILTER clause for use in MDX queries in InterSystems IRIS Business Intelligence. Since this function begins with %, it means this is a special MDX extension created by InterSystems. It allows users to insert an SQL statement that will be used to restrict the returned records in the MDX Result Set. This SQL statement must return a set of Source Record IDs to limit the results by. Please see the documentation for more information.

Why is this useful?

This is useful because there are often times users want to restrict the results in their MDX Result Set based on information that is not in their cubes. It may be the case that this information may not make sense to be in the cube. Other times this can be useful when there is a large set of values you want to restrict. As mentioned before, this is not a standard MDX function, it was created by InterSystems to handle cases were queries were not performing well or cases that were not easily solved by existing functions.

6 0
2 683
Article
· Aug 13, 2021 4m read
Building Analytics Solution with IRIS

Hi developers!

How to build an analytics solution with InterSystems IRIS?

To begin with, let's agree on the points of what is the analytics solution - and this could be a very wide topic. Let's limit the set of solutions to those you can present in the Analytics contest.

There are three kinds of analytics solutions that we will review here: monitoring, interactive analytics, and reporting.

Monitoring

The typical monitoring solution consists of an online dashboard with KPIs that are being actively updated.

The key use case is of monitoring is to visually observe the KPI of fresh data every moment to react in case of an emergency.

Interactive Analytics

This solution supposes a set of interactive dashboards with filters and drill-downs.

The key use case is to explore the data with filters and drill-downs making business decisions upon graph and table data visualization.

Reporting

Reporting solution provides a set of static (usually) reports in a form of HTML or pdf documents that deliver the data in graph and text form in a predesigned form and could be sent via email.

The typical use case of a reporting system is to obtain reports on a given period that will illustrate the status of the product, process, service, sales, etc that is crucial for the business.

How InterSystems products could be used to build such solutions? Let's discuss this below!

3 0
1 463

Using InterSystems Embedded Analytics March 6-10, 2023 – Virtual 9:00am-5:00pm US-Eastern Time (EST)

This course is offered only a few times each year so take advantage of this session!

  • This five-day course teaches developers and business intelligence users how to embed real-time analytics capabilities in their applications using InterSystems IRIS Business Intelligence and Natural Language Processing.
  • The course presents the basics of building data models from transactional data using the Architect, exploring those models and building pivot tables and charts using the Analyzer, as well as creating dashboards for presenting pivot tables, meters, and other interactive widgets.
  • The course also covers securing models, tools and elements (dashboards, pivot tables, etc.) using the InterSystems security infrastructure.
  • Additionally, the course presents topics such as customizing the User Portal, troubleshooting and deployment.
  • This course is applicable for users of InterSystems IRIS Data Platform, InterSystems IRIS for Health, and DeepSee.
  • Register Here
0 0
0 124

The DeepSee Shell best Practices Series - Execute an MDX query in the DeepSee Shell with/without results cache

This cache is different from cache reset. Cache reset clears everything in the namespace but “cache off” only clears the cache in ^DeepSee.Cache.Results and ^DeepSee.Cache.Axis global node for the corresponding cube. The difference is quite smaller in the case as below, but in some cases it can be a big difference.

2 0
0 467

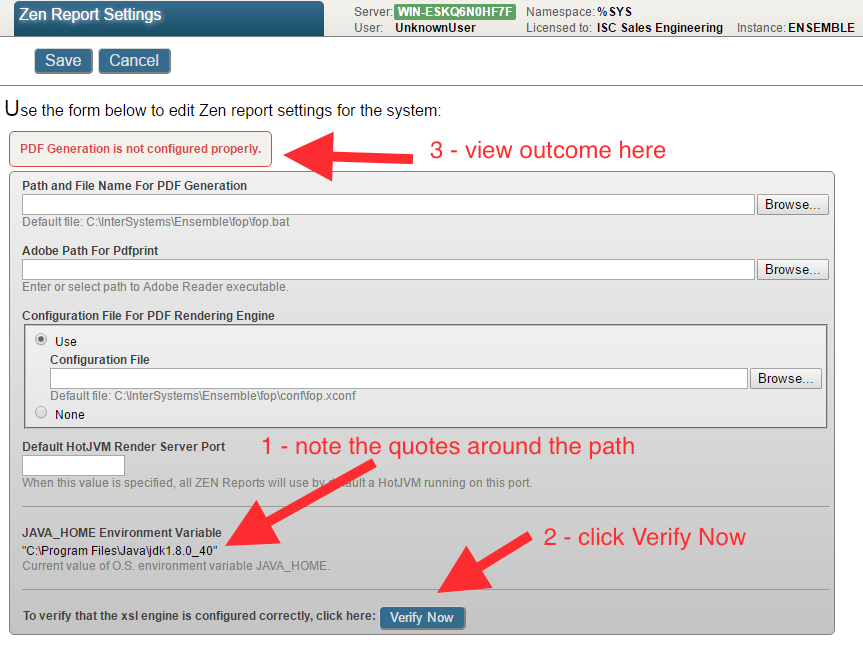
You may experience errors executing Java programs that rely on the JAVA_HOME environment.

For example when Create PDF from this pivot in DeepSee or in this case, outputting a Zen Report as PDF.

You can verify the PDF generation configuration by clicking on the Verify Now button on the Management Portal System > Configuration > Zen Report Settings page:

1 0
0 900

When using Related Cubes in InterSystems IRIS BI, cubes must be built in the proper order. The One side must be built before the Many side. This is because during build time for the Many side, it looks up the record on the One side and creates a link. If the referenced record is not found on the One side, a Missing Relationship build error is generated. The One side is going to be the independent side of the relationship, AKA the side of the relationship that is referenced by the Many side or the Dependent cube. For example: Patients contain a reference to their Doctor.

3 0
0 551

Hi Developers!

Here're the technology bonuses for the InterSystems Analytics contest that will give you extra points in the voting.

Adaptive Analytics (AtScale) Cubes usage - 4 points
InterSystems Adaptive Analytics provides the option to create and use AtScale cubes for analytics solutions.

You can use the AtScale server we set up for the contest (URL and credentials can be collected in the Discord Channel) to use cubes or create a new one and connect to your IRIS server via JDBC.

The visualization layer for your Analytics solution with AtScale can be crafted with Tableau, PowerBI, Excel, or Logi.

Documentation, AtScale documentation

Training

1 0
0 321

When we work with IRIS, we usually have the ability to quickly deploy a ready-to-use infrastructure for BI (data, analytical cubes, and IRIS BI dashboards) using modules. When we start using Adaptive Analytics, we typically want to have the same functionality. Adaptive Analytics has all the tools that we need. The documentation contains a description of how to work with an open web API. All interactions between the user interface and the engine also occur via the internal web API and can be emitted.

2 0
0 325
Announcement
· Dec 10, 2015
Welcome to the DeepSee Group

Welcome to the DeepSee Group.

The Developer Communty has a lot of DeepSee content including all the DeepSee documentation and over 50 videos.

Please use the Developer Community to asks questions, share your experience, and learn more about DeepSee.

I look forward to your participaton in the DeepSee Group of the InterSystems Developer Community.

Joe Gallant

Senior Product Manager

1 0
0 255

Hi, Community!

If you do not know much about DeepSee technology, this video on is exactly for you:

DeepSee Webinar

https://www.youtube.com/embed/4P45m6LjhPE
[This is an embedded link, but you cannot view embedded content directly on the site because you have declined the cookies necessary to access it. To view embedded content, you would need to accept all cookies in your Cookies Settings]

2 0
0 241

In the previous part of this series, we saw how to include data in a portlet from within DeepSee. This used the built in data controller. In this part, we are going to be pulling in data from outside of DeepSee. This will include both information from within InterSystems IRIS and from the OS.

Why use this?

This is useful if you would like to create a dashboard that only contains information about your system. It is also useful if you want to display data about your system along side data that you have stored in DeepSee.

2 0
0 358

Hey Community,

Enjoy watching the new video on InterSystems Developers YouTube:

Reporting & Business Intelligence: What's New? @ Global Summit 2022

https://www.youtube.com/embed/H2KiAk4c6jU
[This is an embedded link, but you cannot view embedded content directly on the site because you have declined the cookies necessary to access it. To view embedded content, you would need to accept all cookies in your Cookies Settings]

0 0
0 217

The DeepSee Shell Best Practices Series - Example of using the MDX subquery flag in the DeepSee Shell

We have different flags for DeepSee advisors to look into the execution details and the methods DeepSee is using to do calculations.

flag [flagname] [on|off] – Turn a diagnostic on or off.

flag cmbr on|off – Show current member processing.

flag compound on|off – Show rewrite of compound queries.

2 0
0 494

Hi Devs!

Last weekend I had been testing the newborn csvgen module and was looking for a CSV file to test - thus I came across an interesting datafile on Data.World with Game of Throne episodes statistics. Death statistics. These folks documented all the murders through all the 8 seasons and noted where, who, from what clan with what weapon had killed another one.

So I imported it and made an IRIS Analytics dashboard.

You Know Nothing, Jon Snow | You Know Nothing, Jon Snow | Know ...

Don't worry, Jon, with this dashboard we can figure out something ). See the details below.

6 0
2 718

Previously I have already tried to play with Google Data Studio when I connected it to InterSystems FHIRaaS. It has quite a nice UI, with a few chart types available out of the box, it can be quite easily connected to some plain tables (stored as CSV or JSON, for instance), and gives the ability to build quite flexible analytics over it. So, I have decided to implement a new connector to InterSystems Analytics (DeepSee), with the ability to select a cube and do some queries on it.

3 0
0 362

Today we will talk about Adaptive Analytics. This is a system that allows you to receive data from various sources with a relativistic data structure and create OLAP cubes based on this data. This system also provides the ability to filter and aggregate data and has mechanisms to speed up the work of analytical queries.

6 0
1 720

Why log in to view pivot tables when you can have them delivered directly to your inbox? Are you in need of automated reporting for InterSystems IRIS Business Intelligence? Pivot Subscriptions is your solution: a tool for subscribing to scheduled email reports of pivot tables inside InterSystems IRIS Business Intelligence (previously known as DeepSee).

6 0
1 557

As said in the previous article about the iris-fhir-generative-ai experiment, the project logs all events for analysis. Here we are going to discuss two types of analysis covered by analytics embedded in the project:

2 0
1 262