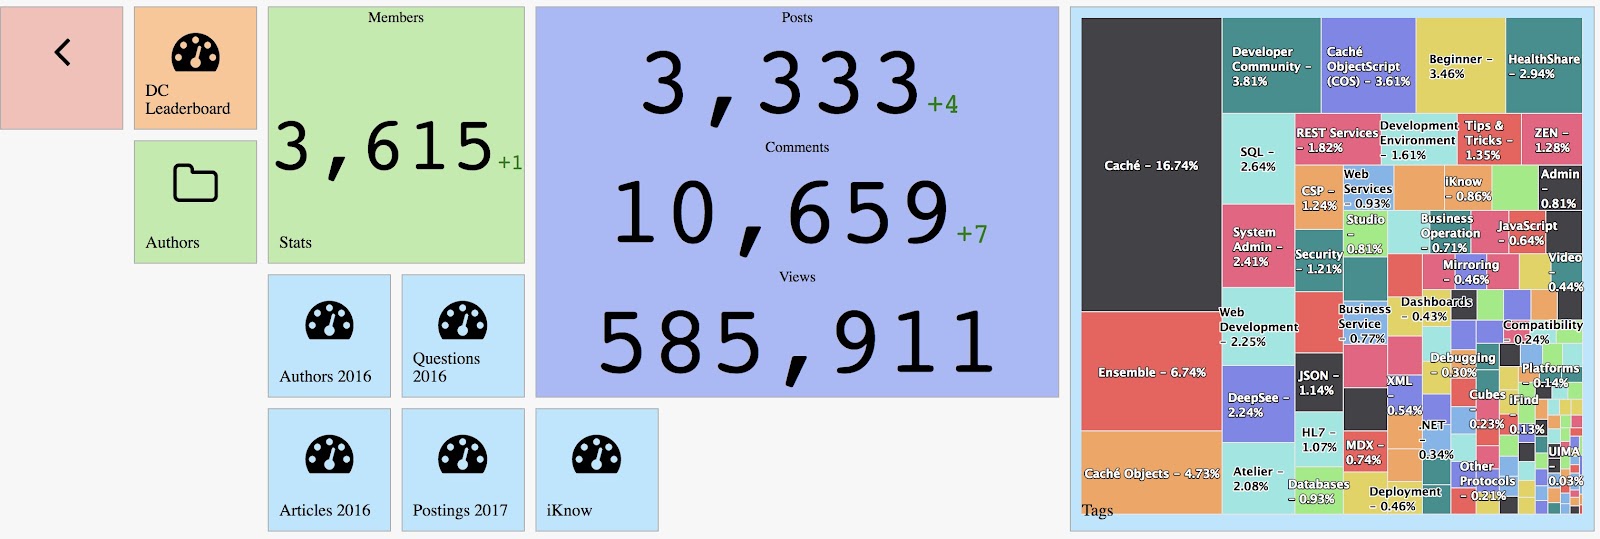
By date
I have a server with rusw locale but in my cube the time dimension shows dates such as "JAN-2018". Is there a way to either localize that (preferably) or just output numbers like "01-2018"?
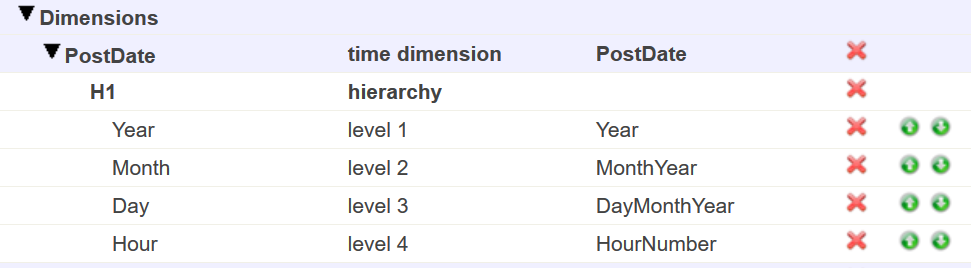
Architect:
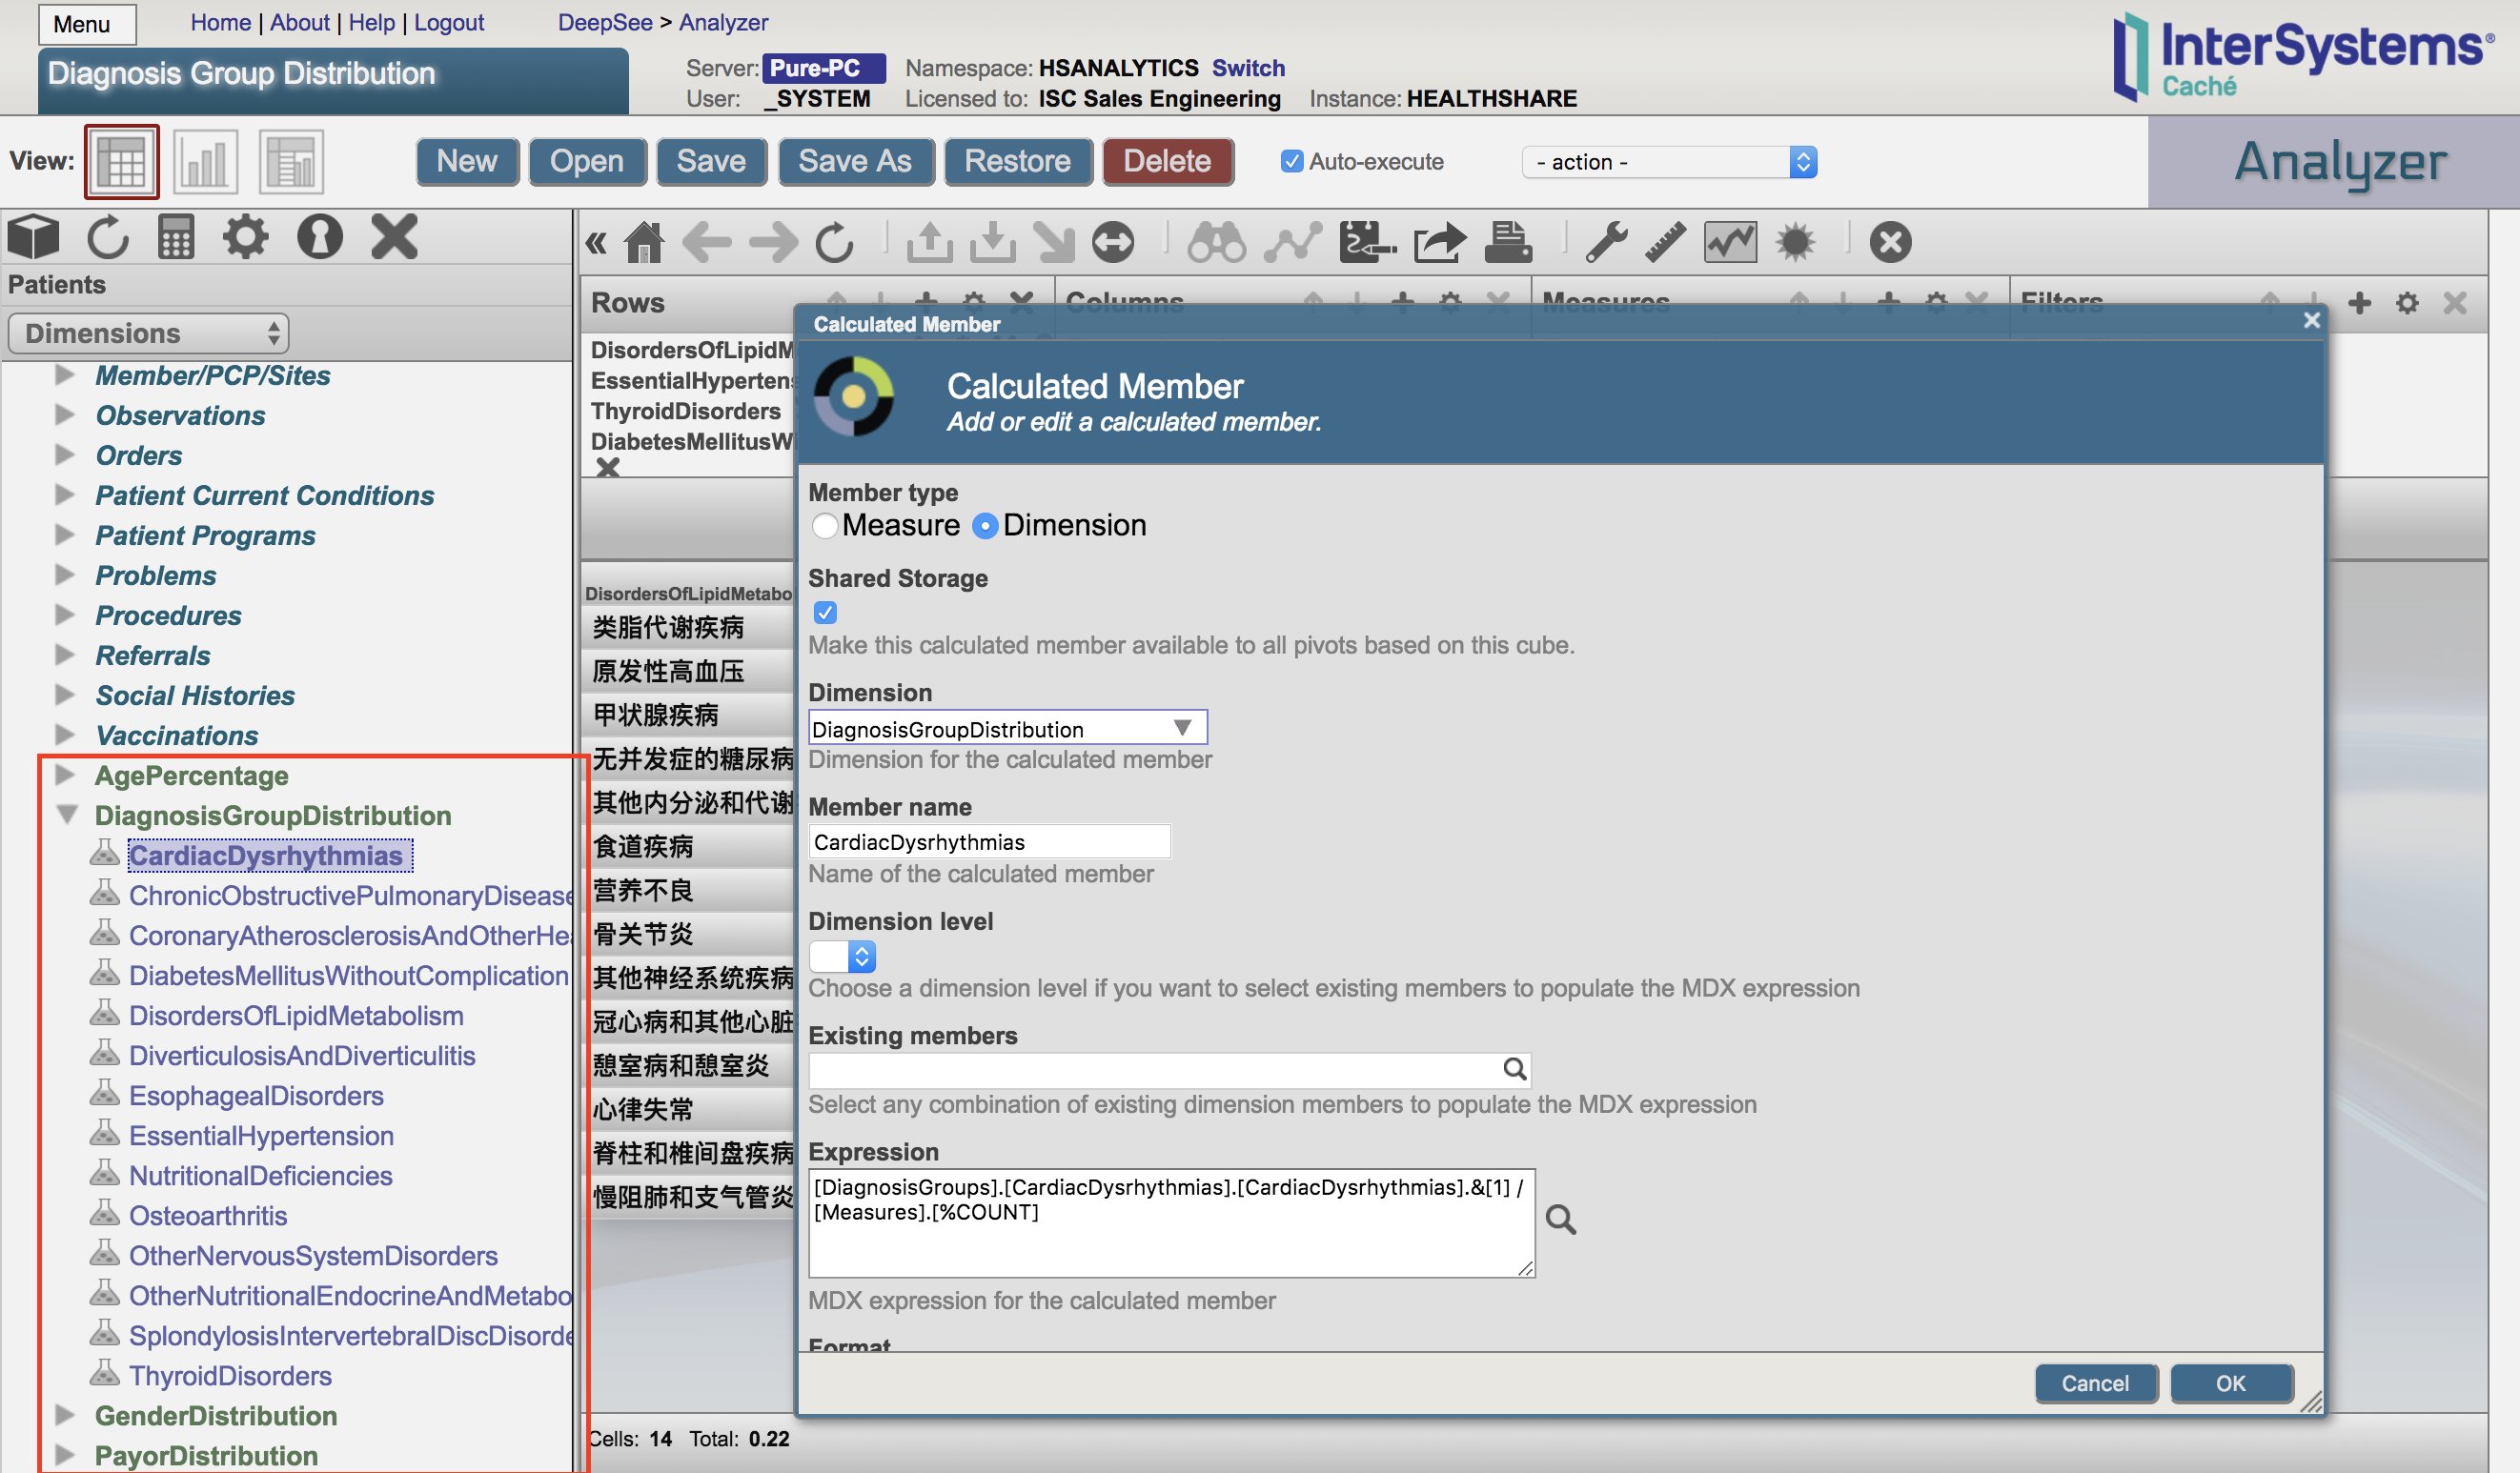
Analyzer:
Also in architect, in level settings there is a "Time Format" property, what's that? Tried setting it to 3 but it didn't help.