Article
· Dec 31, 2019 3m read
Portlets that use data from DeepSee


In the previous part of this series, we saw how to reference a web page that will enhance our dashboard experience. Now we will look into referencing data that is already in our cubes.

In this example, we will be referencing the controller object and we will be extracting data from it. This data will then be displayed as text in our Dashboard. In Part 5, we will show how to incorporate this data into other charting libraries.

2 0
0 215

Hi guys!

I'd like to present you my new project: iris-analytics-notebook, a notebook approach to use IRIS analytics capabilities.

Project description

In past few years, notebooks tools like Jupyter are gaining popularity due its natural way to express ideias.

An almost unipresent tool for data scientists, notebook can also help to improve the impact of analytics tools for all sort of users.

2 0
0 202

The DeepSee Shell best Practices Series - Execute an MDX query in the DeepSee Shell with/without results cache

This cache is different from cache reset. Cache reset clears everything in the namespace but “cache off” only clears the cache in ^DeepSee.Cache.Results and ^DeepSee.Cache.Axis global node for the corresponding cube. The difference is quite smaller in the case as below, but in some cases it can be a big difference.

2 0
0 407

The DeepSee Shell Best Practices Series - Example of using the MDX subquery flag in the DeepSee Shell

We have different flags for DeepSee advisors to look into the execution details and the methods DeepSee is using to do calculations.

flag [flagname] [on|off] – Turn a diagnostic on or off.

flag cmbr on|off – Show current member processing.

flag compound on|off – Show rewrite of compound queries.

2 0
0 434

In the previous part of this series, we saw how to include data in a portlet from within DeepSee. This used the built in data controller. In this part, we are going to be pulling in data from outside of DeepSee. This will include both information from within InterSystems IRIS and from the OS.

Why use this?

This is useful if you would like to create a dashboard that only contains information about your system. It is also useful if you want to display data about your system along side data that you have stored in DeepSee.

2 0
0 313

Today my customer ask me a question about how to write the MDX with a summary row however this row with different aggregate functions for each column.

We know in DeepSee analyzer has pivot table option "Summary", user can select sum, avg ... aggregate functions to get the summary row/column. However we can not specify different aggregate function for each measure column.

Here show the example to use All level and IIF function achieve that. see the example (Holefood cube in Sample namespace) below

WITH MEMBER measures.[with avg summary info] AS

2 6
0 1.1K

The following post outlines a more flexible architectural design for DeepSee. As in the previous example, this implementation includes separate databases for storing the DeepSee cache, DeepSee implementation and settings, and synchronization globals. This example introduces one new databases to store the DeepSee indices. We will redefine the global mappings so that the DeepSee indices are not mapped together with the fact and dimension tables.

2 1
0 536

Preview Mode was added to InterSystems IRIS Business Intelligence to give designers a quick view of what their resulting Pivot Table will look like without needing to wait for the results to fully execute. This can be beneficial when designing pivot tables because if you are dragging and dropping elements to see how they look/work in your pivot table and seeing if they have the desired data. Since you are exploring and designing, you don't necessarily care about the results at the moment, but you would still like to see how your table looks with the changes you have made.

2 0
0 356

Hi, Community!

You know, that when we build hierarchies in DeepSee dimension all the members of lower level should be the part of one member of the higher level.

If not you'll get some empty results in MDX queries with this hierarchy.

With Time dimensions the obvious valid hierarchy is Year->Month->Day, cause every Month consists of one Year and every day consists of one month.

2 3
0 393

InterSystems IRIS Business Intelligence allows you to keep your cubes up to date in multiple ways. This article will cover building vs synchronizing. There are also ways to manually keep cubes up to date, but these are very special cases and almost always cubes are kept current by building or synchronizing.

2 1
0 542

System Monitor is a flexible and highly configurable tool supplied with Caché (Ensemble, HealthShare), which collects the essential metrics of the operating system and Caché itself. System Monitor also notifies administrators about issues with Caché and the operating system, when one or several parameters reach the admin-defined thresholds.

1 2
2 1.3K

When analyzing data, there is often a need to look at specific indicators more thoroughly and to highlight sections of information of particular interest to a user.

For instance, examining the data dynamics for specific regions or dates can help us uncover some hidden trends and patterns that will allow us to make an informed decision about our project in the future.

1 0
1 255

Power BI dashboards provide us with a good way to analyze aggregated information. We can even choose time periods for aggregation (you can find more details regarding it in our article about drill down). However, we might still be interested in a detailed look at specific data points. With the right data filling, we can display detailed data for any column of the chart with all filters applied to that chart.

1 0
0 821

Users of analytical applications often need to generate and send out PDF reports comprised of elements of the analytical panel. In the InterSystems stack, this task is solved using the DSW Reports project that is an extension of DeepSeeWeb. In this article, we will explain how to use DSW Reports for generating PDF reports and emailing them.

1 0
1 501

In the previous part of this series, we saw how to define a basic portlet. Now we will look into making this portlet reference a web page that will enhance our dashboard experience.

In this example, we will be embedding a Developer Community article along side a couple of widgets displaying information related to the number of views on the Developer Community articles. This example is not hosted on the Community Analytics server, but if it was we could see the view counts going up as we interacted with the page.

Why use this?

In a real case, perhaps you have an embedded page from an external web site showing the current Emergency Room wait times for Hospitals in your area. This portlet can be used along side widgets from your Emergency Room showing how many people are waiting, how many doctors are active, and how many people are being treated. As other Emergency Room wait times grow, you can possibly expect your volume to increase as well. This can help you make decisions on how to allocate resources.

1 0
0 369

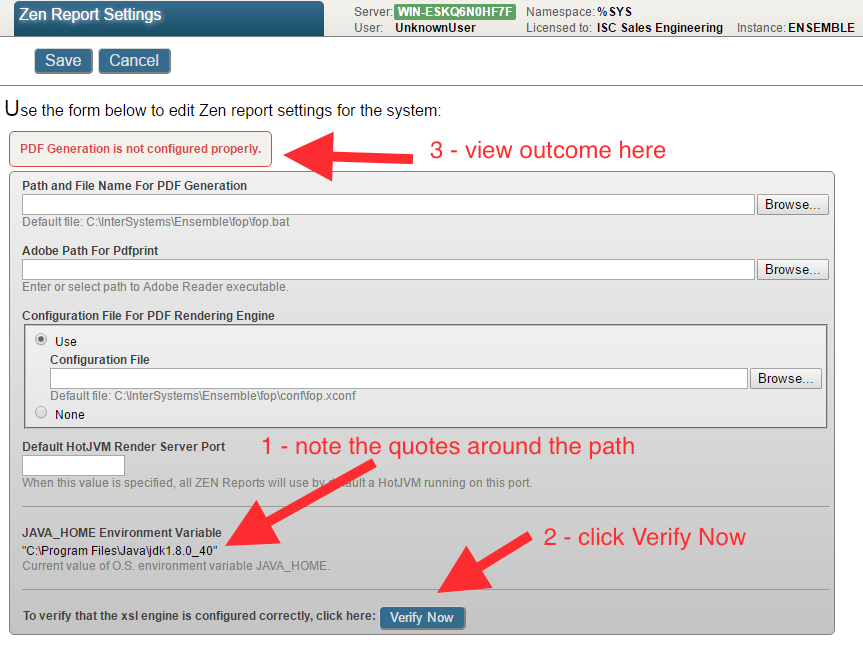
You may experience errors executing Java programs that rely on the JAVA_HOME environment.

For example when Create PDF from this pivot in DeepSee or in this case, outputting a Zen Report as PDF.

You can verify the PDF generation configuration by clicking on the Verify Now button on the Management Portal System > Configuration > Zen Report Settings page:

1 0
0 767

Hi Developers!

Many of you are looking for samples on how to work with InterSystems IRIS Analytics, formerly known as DeepSee.

There is a Samples BI module with Patients and Holefoods examples which is available on Github with source code. The installation steps are clear but take time.

Recently we added the option to run IRIS Community Edition containers with ObjectScript Package Manager (ZPM) on board. This simplifies the installation to the "run-one-command" step for the modules submitted to ZPM Community Registry. And thus we can benefit the Samples BI installation with ZPM.

And here is how you can run it on your laptop. Let's go!

1 1
0 336
Article
· Mar 2, 2020 2m read
SQL -99 error while viewing a listing

This error is sometimes seen while viewing a listing in InterSystems IRIS Business Intelligence:
ERROR #5540: SQLCODE: -99 Message: User <USERNAME> is not privileged for the operation (4)

As the error suggests, this is due to a permission error. To figure out which permissions are missing/needed, we can take a look at the SQL query that is generated. We will use a query from SAMPLES as an example.

1 0
0 784
Article
· Aug 31, 2016 1m read
DeepSee cubes building troubleshooting

Hi!

Sometimes you see that call to DeepSee cube building method:

w ##class(%DeepSee.Utils).%BuildCube("CubeName")

does nothing.

Here are my 2 cents on possible reasons.

1. Run DeepSee Reset method in certain Namespace:

NAMESPACE> w ##class(%DeepSee.Utils).%Reset()

and try again.

2. Make sure, that all the indices in your base class for the cube are rebuilt, rebuild them and run it again:

1 2
0 369

This post provides further detail on the suggestions from the DeepSee Troubleshooting Guide about what to do if a user is not able to view a listing in a DeepSee cube, but instead sees errors like this:

ERROR #5540: SQLCODE: -99 Message: User <username> is not privileged for the operation [zfindStatement+118^%SQL.DynamicStatement.1:<namespace>] (8)

1 1
0 808