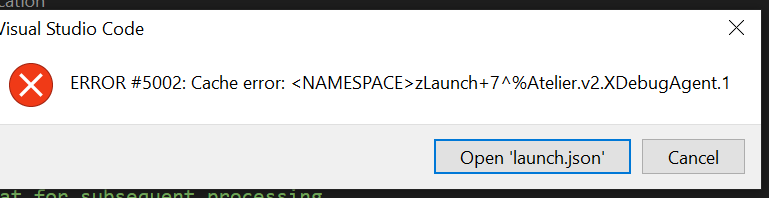
If I open a terminal and type the following commands, sc is an error:

set validator = "sc = ##class(%Library.Numeric).IsValid(""BLAH"")"
set @validator
write sc

At the end, when I write sc I get:

0 L'BLAH9
             DOCXT010,#e^zIsValid+1^%Library.Numeric.1^1e^^^1

However, if I call the following class method using the arguments "%Library.Numeric" and "BLAH", sc is undefined

0 12
0 377

How to find a global's original namespace ? Potentially mapped from a different namespace .

I have a global ^Custom that exists in multiple namespaces but it could mapped from namespace Drone(A) to Launch(B)

Without access to Cache management portal how to find where is my global located using cache code ?

Like if ^Custom == ^[Drone]Custom ??

0 5
0 308

Hi,

I'm getting thousands of errors like the ones below:

2021-05-03 14:11:44 [SQLCODE: <-400>:<Ocorreu um erro fatal>] [Cache Error: <<READ>Dispatch+14^%SYS.BINDSRV>] [Location: <ServerLoop>] [Client info: <Username: KIORAS, Node Name: 3IK0VLS5UU, IP Address: 192.168.1.223, Executable Name: EXTRService.exe, Internal Function: B0>] [%protocol: <52>] $Id: //ce/2018.1.2/kernel/common/src/aclass.c#1 $ 23468 104

0 1
0 463

Hi

How do I view the .int code of a compiled class in VS Code?

I am trying to use gj::Locate and the setup works, the explanation is all fine but when i paste an error from the Error Logs into the gj::locate it firstly tells me that it can't find the .cls and when I paste in the .int reference in the text box where you can specify the class, method, line+offset it replies that it can't find the item.

This is something to do with the objectscript extension rather than gj::locate

Nigel

0 3
0 383

I have multiple projects that I utilize when debugging in Cache Studio. One of my projects suddenly lost the ability to step through commands with the yellow box and the cursor moving though code lines. The cursor just sits at the entry line while variables apparently do change. Interestingly enough, if I change the project and the debug target, the "yellow box" ability is still there. Apparently losing this functionality is by project/debug target/whatever. The goal is, of course to return it back but how?

0 24
0 545

Someone may have asked this before but is there a way to return the TRACE statements that we have placed in the Data transformation within the DTL Editor Testing Tool (EnsPortal.Dialog.TestTransform.cls)? Is this something we can get in an Enhancement request in for?

It would save sometime in troubleshooting where an error might be in the DTL.

Just wondering...

Thanks

Scott

0 1
0 250
Question
· Sep 11, 2020
Automatic Watch variables

I come from Visual Studio and now I use mostly Cache 2017 Studio. One debugging functionality I miss dearly is current local variables automatically appearing in the Watch Variables window together with their values. Yes, I can hover or type them myself but both actions take extra time which is especially noticeable when debugging unfamiliar code across many routines. Any Cache settings or plugins to that effect? If not then why not? And if nothing else is there in Cache, what are the alternatives or hacks in this respect?

Anna

0 12
0 309

Hi i have rules and i want to log them to analyse what rules executed , I want to add in the log Msg Controller Id, MRN, Value coming in the message, and my customize text telling whats wrong with this field... i have like 50 rules and at the end i can check the log table and found like 20 entries so it means 20 data issues are there for a given message control id. any advice how to to do it

0 3
0 219

Hi Developers

Is there any way that we can pass the values to the read prompts via cache routine.

For example, we have a couple of reports/routine in our system which accepts some inputs and after taking the inputs it generates some data. Right now it has proper UI and where User enters the value and in routines we have Read statements which accepts those inputs for further processing.

0 7
0 473

Running Cache 2017.2.2.

I'm trying to make a REST API call in JSON format. When using the example in the class reference documentation the getJSON method in the %Net.Http class throws the error <METHOD DOES NOT EXIST> on a %Clone() method in the %LIbrary.DynamicObject class. I even changed the parameter to a JSON string to no avail. The code will then fail on the %Compose method (examples below). My workaround is to use the %Net.HttpRequest functionality. Is there another workaround to this?

0 2
0 233

Hi everyone,

I have an existing application on HealthShare 2015 and decide to move it to HealthShare 2018 to make use of Atelier support. I am using Eclipse Photon with Atelier Plugin 1.3.

Most of things are working better on Atelier comparing with Built-in studio of HealthShare. However, when I tried debugging CSP file with Atelier I encounter 2 problems:

1.

0 1
0 315

Hi,

I have a HealthShare HealthConnect operation which uses the EnsLib.HTTP.OutboundAdapter. It is using a custom Operation class to send HTTP Post request. The request data that is sent to the operation and the response back from the operation is not displayed on the visual trace. Is there anyway to display this data in the trace?

Thank you for your help.

1 7
0 571

Hello,

I am reading in an X12 document into my production that needs to be processed and returned as a CSV file. I have created a record map to support the fields I want to extract with a batch class to store headers. I have a DTL mapping the data to the appropriate fields in the record map and am sending the record map to a EnsLib.RecordMap.Operation.BatchFileOperation.

0 2
0 784

Hi everyone,

I've encountered this annoying issue so many times before, if any one also encounter this issue, please share here if you have any solution.

So, I've been working on a web service project using HealthShare 2015. Sometimes I have to set a debug target to a csp file to debug it. If I pause the debug process about 3 minutes above or so (to examine an object, variable, etc..) the studio will hang.

0 4
0 373

Hello,

I have a couple of IOT devices that communicate via WebSockets to our backend.

I successfully managed to create a websocket connection between server and (iot)client using %CSP.WebSocket
However I would like to implement authentication on this using the HTTP headers at the same time of Connection: Upgrade.

I tried to set the headers to globals in order to debug but they are always empty.

Example code:

0 1
0 253

OAuth server to be deployed on the IRIS learning cloud platform. Clients - one on the other instance of the learning IRIS server, the other client locally on my computer in the container docker.

Both clients get a seemingly correct link (through ##class(%SYS.OAuth2.Authorization).GetAuthorizationCodeEndpoint()) to the login request form:

1 3
1 768

I am fairly new to Cache and ObjectScript. I have a new task I have created with a corresponding method that I am trying to debug in Studio (2013).

My ClassMethod looks like this

ClassMethod DoMyWork(Output pWorkCount as %Integer,  pInput1 As %Integer = 30)

{

/* Does some work here and increments pWorkCount */

}

When I try to debug this using studio, I browse to my method but I am not certain what to put in here for the input parameter 'pWorkCount'.

0 3
0 636

Hello,

Last weekend we've updated our Caché version to

Versie:Cache for Windows (x86-64) 2018.1.1 (Build 312U)

I'm using Studio to develop. I've been using the built-in debugger and it has been working nicely. But now, since the upgrade, I'm getting this error when trying to debug any routine or class method:

0 11
0 895

Our development server is set up to automatically keep the .INT code of compiled classes and routines, but the live servers are set to not keep the .INT code.

I know how to set the system to keep this code ($SYSTEM.OBJ.SetQualifiers() ?) but what are the ramifications of keeping this code on the live servers? Is it just a space issue? I always thought it was to keep the code more private.

0 4
0 531