By update
Hi developers,
We're excited to let you know about the latest release of Serenji, your on-the-spot debugger from George James Software. Version 3.2.0 focuses on the debug experience and introduces zero configuration for users. No matter where you are or what you're doing, Serenji is always ready to go in just one click, so you won't lose focus by spending time setting up a launch configuration.
This enhanced debugger also takes advantage of the latest features of VS Code itself. With this powerful combination you'll be able to smoothly identify and quickly fix errors in your code, contributing to the production of quality, maintainable code... and isn't that what everyone wants?!

In this latest release you will experience:
- Debugging in just one click with zero configuration.
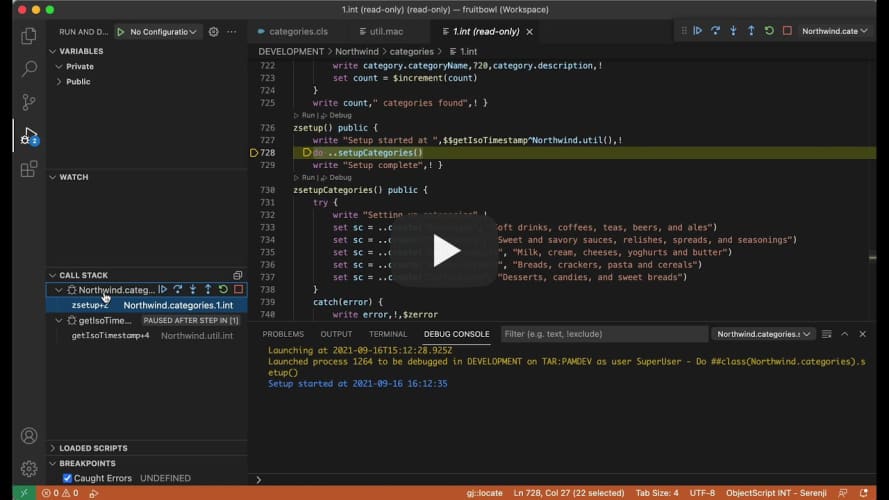
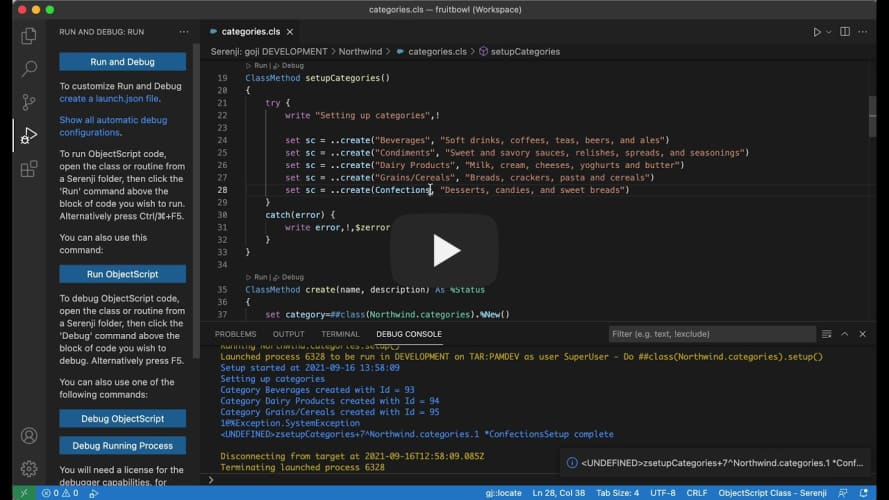
- Navigation directly to the source of an error using our gj :: locate technology.
- Intuitive prompting for entrypoint and arguments.
- Configurable break on error.
- Program output in debug console.
- Run and Debug CodeLenses.
- Run multiple concurrent debug sessions and consoles.
- Shaded background for read-only documents.
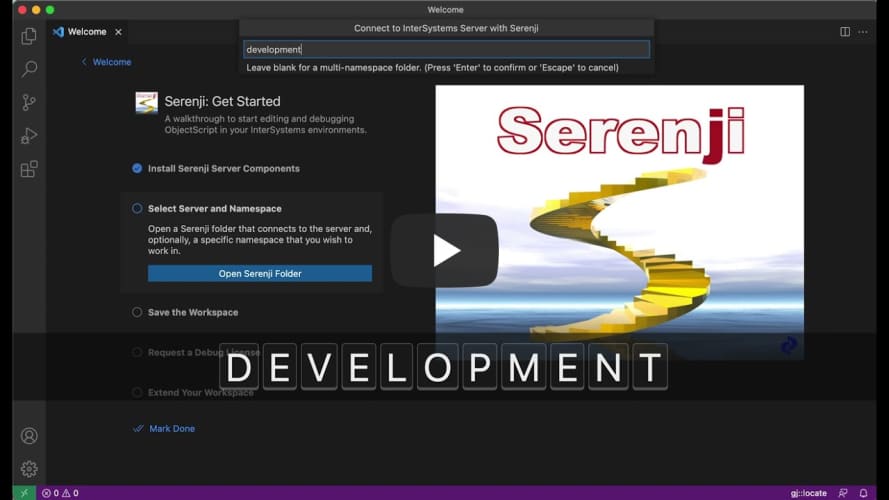
If you're a new user, it's now easier for you to get started. The introduction of a welcome page Walkthrough and guidance on the Explorer and Run and Debug views means you can effortlessly create your initial workspace and start debugging.
Download Serenji directly from the VS Code marketplace and take a look at our release notes to find out more about these new features and how to use them.
We offer a free 30 day trial so if you're not yet a user of Serenji but you're interested in how it can help you, drop me a message through the Developer Community or email us at info@georgejames.com.
Happy debugging!
.png)

.png)