This tag relates to the discussions on the development of analytics and business intelligence solutions, visualization, KPI and other business metrics management.
I have a method like this and I want to be able to see the results on the terminal, how do I run this method on a terminal to display the results of this SQL query?
The row expression defines what dimensions and measures appear on the rows of your pivot table as well as how they appear. Sets and CROSSJOINs are used.
https://www.youtube.com/embed/i32l5ayptaQ [This is an embedded link, but you cannot view embedded content directly on the site because you have declined the cookies necessary to access it. To view embedded content, you would need to accept all cookies in your Cookies Settings]
https://www.youtube.com/embed/gDI2yqvExEc [This is an embedded link, but you cannot view embedded content directly on the site because you have declined the cookies necessary to access it. To view embedded content, you would need to accept all cookies in your Cookies Settings]
Following up the previous part, it's time to take advantages for IntegratedML VALIDATION MODEL statement, to provide information in order to monitor your ML models. You can watch it in action here
The OKR methodology (Objectives and Key Results or Objectives and Key Results) is used by the largest companies in the world (such as Google, Netflix, Spotify, BMW, Linkedin, etc.) for agile performance management. It was created in the 1970s by Andrew Grove, president of Intel, and introduced to the general public in his famous book “High Output Management”.
Around 1998 John Doerr, one of the world's top venture capitalists, after coming into contact with Intel's OKR, introduced the model to Larry Page and Sergey Brin, who started a small company called Google.
I built a dashboard to show hourly instrument capacities based on a term list. The term list consists of the TestInstrumentID and the number of tests that instrument can perform in 1 hour. The calculation works correctly and the data is accurate but periodically if you go to check the dashboard the percentages all get changed to 100% across every hour. If you check it later or add an additional site to the filter then the percentages correct themselves. I don't know what's causing this or how to troubleshoot it because it does calculate correctly but is not consistent.
https://www.youtube.com/embed/cudBxwI1xTA [This is an embedded link, but you cannot view embedded content directly on the site because you have declined the cookies necessary to access it. To view embedded content, you would need to accept all cookies in your Cookies Settings]
This year's Virtual Summit has more content around Analytics and AI than ever before. We've made this quick video to guide you through the program and put things into context with respect to InterSystems overall strategy for Data & Analytics.
https://www.youtube.com/embed/fTcNimWi2y0 [This is an embedded link, but you cannot view embedded content directly on the site because you have declined the cookies necessary to access it. To view embedded content, you would need to accept all cookies in your Cookies Settings]
The release of InterSystems IRIS 2021.1 introduces Adaptive Analytics. To get started with a familiar InterSystems IRIS BI sample cube, we have created a HoleFoods Sample Application for Adaptive Analytics. This Sample Application is available on Open Exchange. There is also a learning services course available to learn more about Adaptive Analytics.
In the previous part of this series, we saw how to reference a web page that will enhance our dashboard experience. Now we will look into referencing data that is already in our cubes.
In this example, we will be referencing the controller object and we will be extracting data from it. This data will then be displayed as text in our Dashboard. In Part 5, we will show how to incorporate this data into other charting libraries.
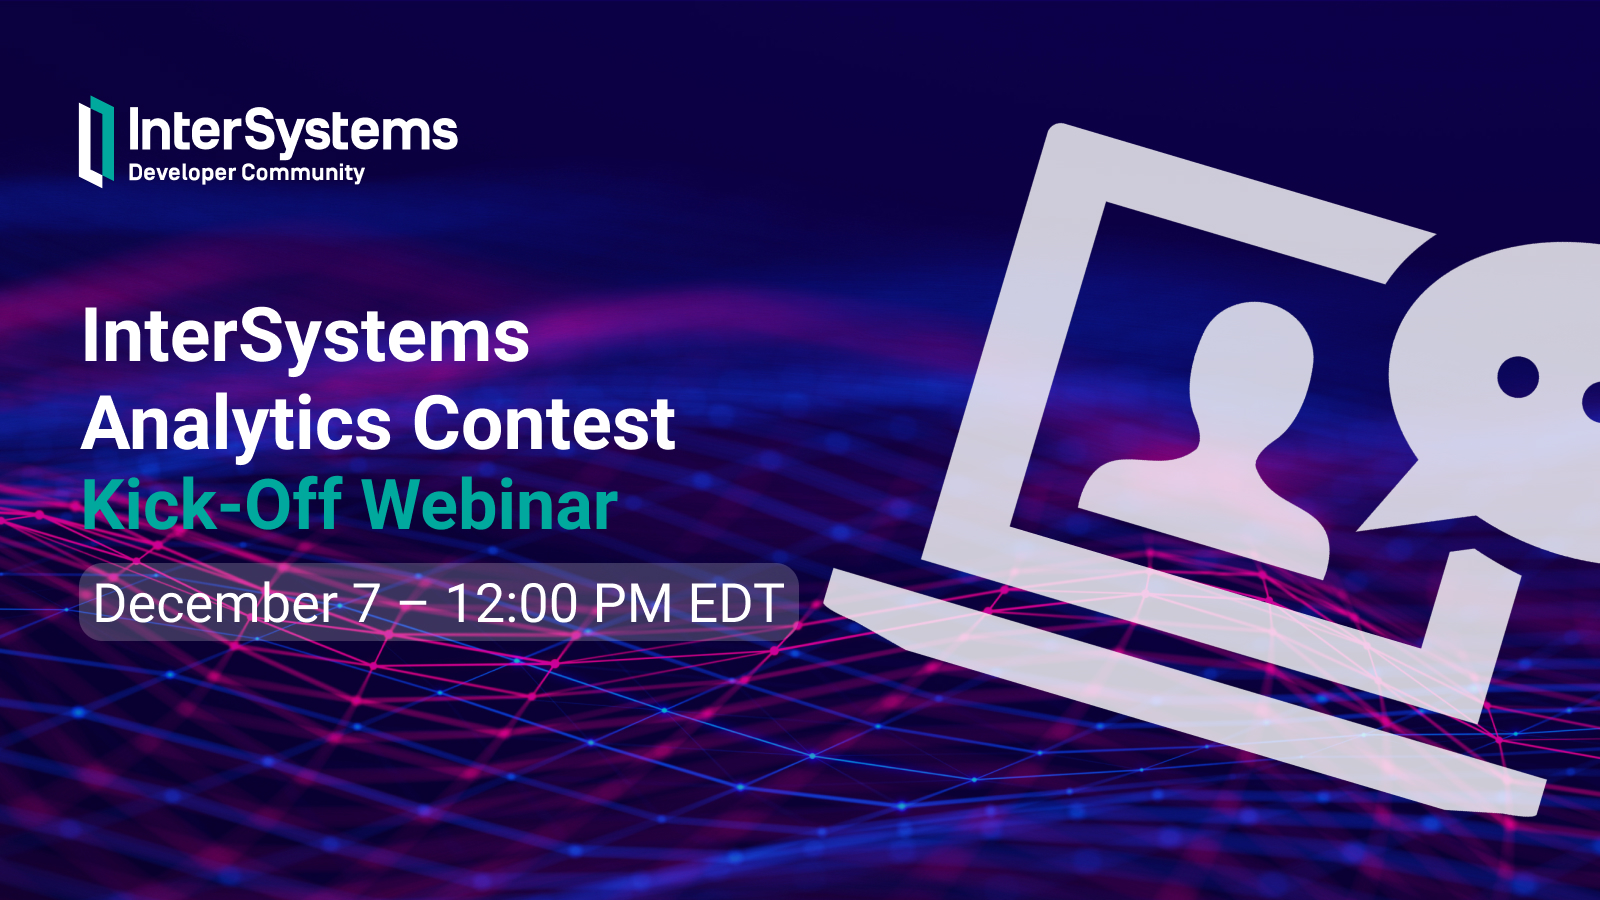
On this webinar, we’ll demo the iris-analytics-template and answer the questions on how to develop, build, and deploy Analytics applications using InterSystems IRIS.
Date & Time: Monday, December 7 — 12:00 PM EDT
Speakers: 🗣 @Carmen Logue, InterSystems Product Manager - Analytics and AI 🗣 @Evgeny Shvarov, InterSystems Developer Ecosystem Manager
While we're working on a new data product supporting the analytics development process, we'd like to test some of the UX (User eXperience) design elements on a real audience. If you've got some battle scars from earlier analytics work and are interested in participating, please complete this survey and we'll get in touch when we have something to show!
Feel free to share this survey with your data-savvy friends and colleagues if you think they match the profile.
As said in the previous article about the iris-fhir-generative-ai experiment, the project logs all events for analysis. Here we are going to discuss two types of analysis covered by analytics embedded in the project:
In Episode 7 of Data Points, product manager @Carmen Logue joined the pod to tell us all about InterSystems Reports — the new reporting feature of InterSystems IRIS! Take a listen to hear about its capabilities, use cases, and how it fits into the existing set of analytics technologies.
https://5e18edf067eb59-03854285.castos.com/player/172127 [This is an embedded link, but you cannot view embedded content directly on the site because you have declined the cookies necessary to access it. To view embedded content, you would need to accept all cookies in your Cookies Settings]
Thank you all for your continued feedback and support of our ad hoc reporting platform, VDM. There's been some questions around setting up a non-ODBC connection for InterSystems platforms. We published a new YouTube video showing the steps necessary to connect to InterSystems Caché and InterSystems IRIS with BridgeWorks VDM.
https://www.youtube.com/embed/PQqfrxIYMoc [This is an embedded link, but you cannot view embedded content directly on the site because you have declined the cookies necessary to access it. To view embedded content, you would need to accept all cookies in your Cookies Settings]
I have a pvot table defined. that generates a set of data. I want. to. execute the pivot table programatically which I believe involves using %DeepSee.ResultSet. Does someone have an example showing how to apply filters to the results?
For. example
[DateTime of Filing].[Date].[Date Filed Year] = &[2023]
I work on an ERP system and am trying to set up a dashboard according to a customer request. It's a pivot table with a few controls and filters, nothing too difficult, but I'm having some issues with drill down.
Watch this video to learn about some recent machine learning engagements InterSystems is driving, including TrakCare predictive analytics and examples from our Developer Community and partners:
https://www.youtube.com/embed/Xminu9GmwEc [This is an embedded link, but you cannot view embedded content directly on the site because you have declined the cookies necessary to access it. To view embedded content, you would need to accept all cookies in your Cookies Settings]
A full cycle project, from initial data initialization, daily update products from the official website, a service for sending a course on request and receiving a schedule for any period.
https://www.youtube.com/embed/hRlUPeRDuCk [This is an embedded link, but you cannot view embedded content directly on the site because you have declined the cookies necessary to access it. To view embedded content, you would need to accept all cookies in your Cookies Settings]
https://www.youtube.com/embed/E3o87dMxamE [This is an embedded link, but you cannot view embedded content directly on the site because you have declined the cookies necessary to access it. To view embedded content, you would need to accept all cookies in your Cookies Settings]
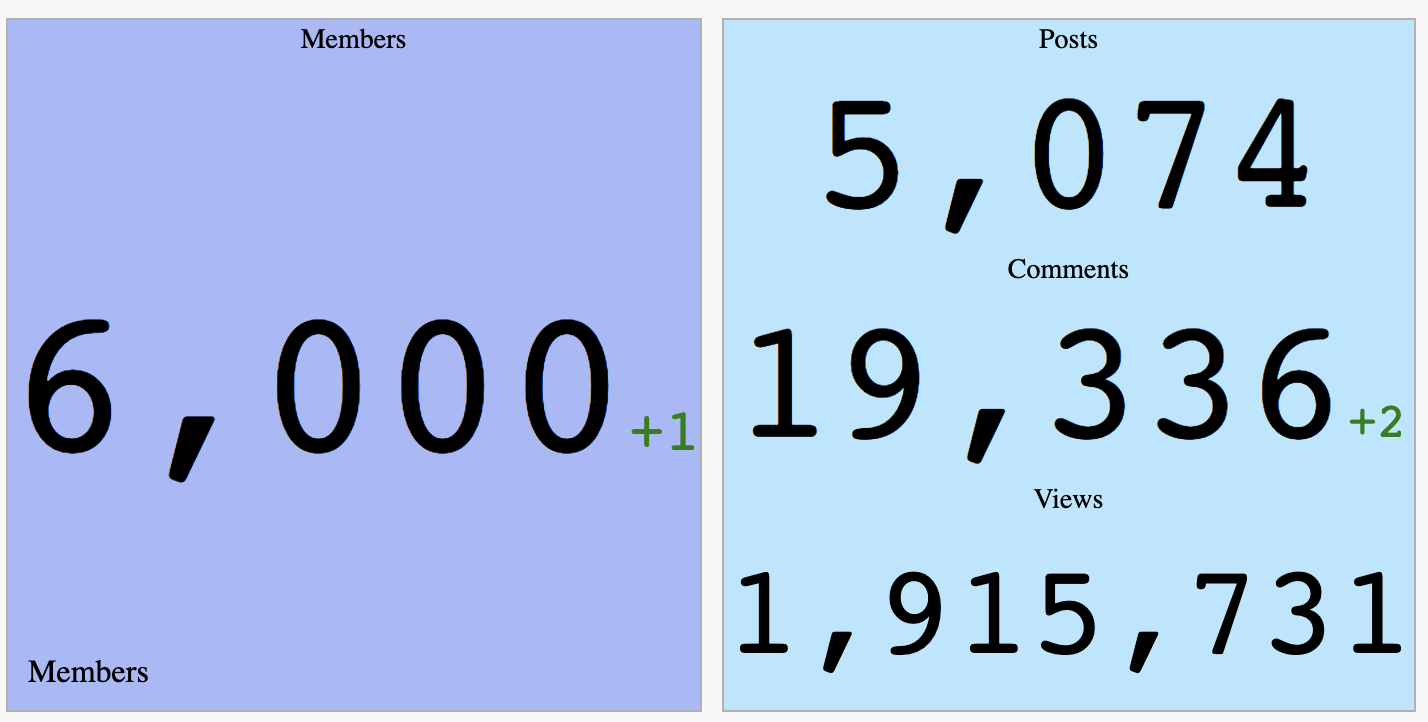
 By views
 Open Exchange app
.png)