What is the shortest frequency of time I can set to have Cubes rebuilt.
This tag relates to the discussions on the development of analytics and business intelligence solutions, visualization, KPI and other business metrics management.
This tag relates to the discussions on the development of analytics and business intelligence solutions, visualization, KPI and other business metrics management.
What is the shortest frequency of time I can set to have Cubes rebuilt.
This is my introduction to a series of posts explaining how to create an end-to-end Machine Learning system.
Our IRIS Development Community has several posts without tags or wrong tagged. As the posts keep growing the organization of each tag and the experience of any community member browsing the subjects tends to decrease.
We can think some usual solutions for this scenario, like:
Following up the previous part, it's time to take advantages for IntegratedML VALIDATION MODEL statement, to provide information in order to monitor your ML models. You can watch it in action here
The code presented here was derived from examples provided by either InterSystems IntegragedML Template or IRIS documentation, my contribution was mainly mashing up such codes. It's a simple example intended to be a start for discussions and future works.
Note: The code presented here is for explanation purpose only.
A few months ago, I read this interesting article from MIT Technology Review, explaing how COVID-19 pandemic are issuing challenges to IT teams worldwide regarding their machine learning (ML) systems.
Such article inspire me to think about how to deal with performance issues after a ML model was deployed.
I simulated a simple performance issue scenario in an Open Exchange technology example application - iris-integratedml-monitor-example, which is competing in the InterSystems IRIS AI Contest. Please, after read this article, you can check it out and, if you like it, vote for me
Now available on Open Exchange is a library of third party charts available to use within DeepSee/InterSystems IRIS BI dashboards. To start, simply download and install, select the new portlet as the widget type, then select the chart type that you desire. If you don't find the type of chart you are looking for, you can easily extend the portlet to implement your desired chart type. These new chart types can be used within existing dashboards or you can create new dashboards using them.

Inter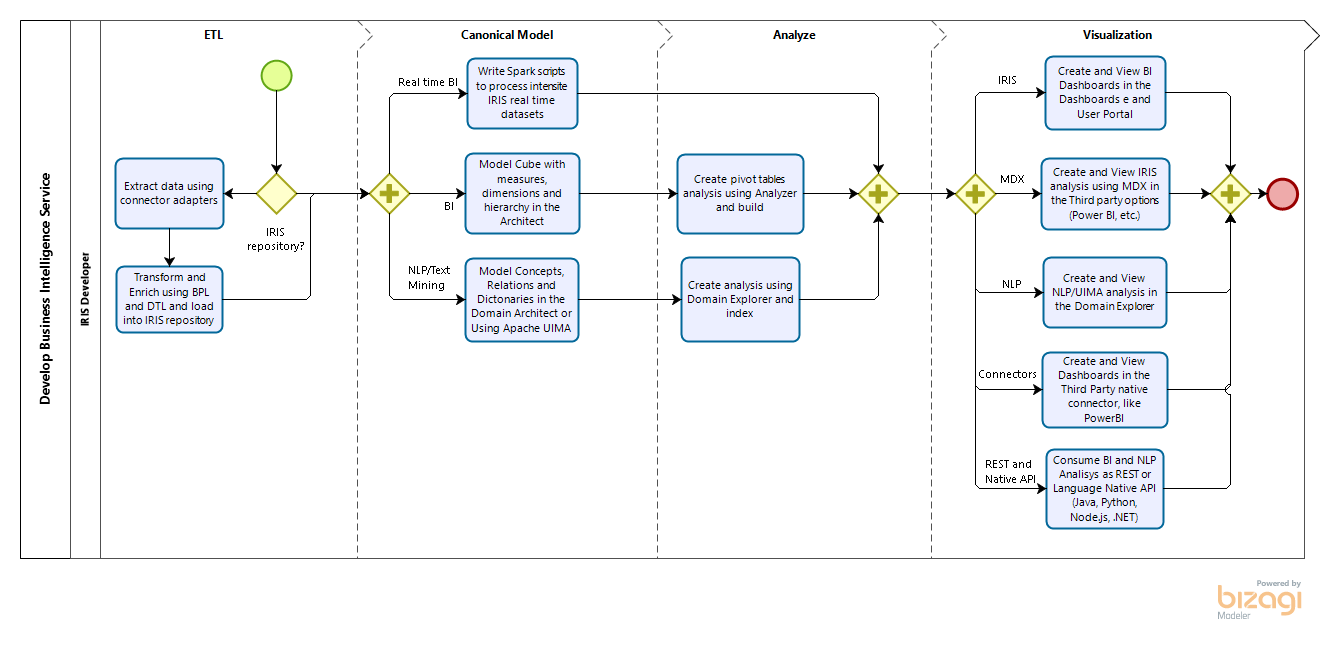
Intersystems IRIS is a complete platform to get insights from SQL and NoSQL data. It is possible get data from Interoperability adapters or using a set of IRIS tables as data sources and model BI or NLP Cubes, covering all type of data (other tools are limited to SQL). There are the option to enable intensive analytics processing using Spark too. So you can model your analysis using IRIS web analyzers (many tools use desktop tools) and than visualize and produce insights using IRIS Dashboards and IRIS User Portal or your third party options, using open options like MDX and REST.
Hi InterSystems Community,
Is there a way to have a logarithmic axis in a DeepSee widget?
Thanks,
Reid
Hello Community,
I hope you are well.
I encounter a problem on IRIS for Unix 2020.1 when I try to create a PDF from a simple Dashboard on Deepsee :
.png)
When I click on this widget , a tab appear and is loading for ~30 seconds, then shows 'error loading the PDF File ' :
.png)
I am also using DeepSee Web, and i encounter a problem if I try to Export the graph as a PDF :
.png)
Is there a link between both problem ? ( If I fix the print widget, the PDF Export will also be fixed ? )
I found someone having the same problem but she fixed it : https://community.intersystems.
Keywords: PyODBC, unixODBC, IRIS, IntegratedML, Jupyter Notebook, Python 3
A few months ago I touched on a brief note on "Python JDBC connection into IRIS", and since then I referred to it more frequently than my own scratchpad hidden deep in my PC. Hence, here comes up another 5-minute note on how to make "Python ODBC connection into IRIS".
ODBC and PyODBC seem pretty easy to set up in a Windows client, yet every time I stumbled a bit somewhere on setting up an unixODBC and PyODBC client in a Linux/Unix-style server.
How to use the IRIS Native API in Python to access globals and plot some charts.
With a large adoption and use in the world, Python have a great community and a lot of accelerators | libraries to deploy any kind of application. If you are curious (https://www.python.org/about/apps/)
As the pandemy evolves in the world a lot of information are being spreaded so I decided to create an application to audit those information.
Preview releases are now available for InterSystems IRIS Advanced Analytics, and InterSystems IRIS for Health Advanced Analytics! The Advanced Analytics add-on for InterSystems IRIS introduces IntegratedML as a key new feature.
The build number for these releases is: 2020.3.0AA.331.0
Full product installation kits, container images, and evaluation license keys are available via the WRC's preview download site.
Community Edition containers can also be pulled from the Docker store using the following commands:
In an ever-changing world, companies must innovate to stay competitive. This ensures that they’ll make decisions with agility and safety, aiming for future results with greater accuracy.
Business Intelligence (BI) tools help companies make intelligent decisions instead of relying on trial and error. These intelligent decisions can make the difference between success and failure in the marketplace.
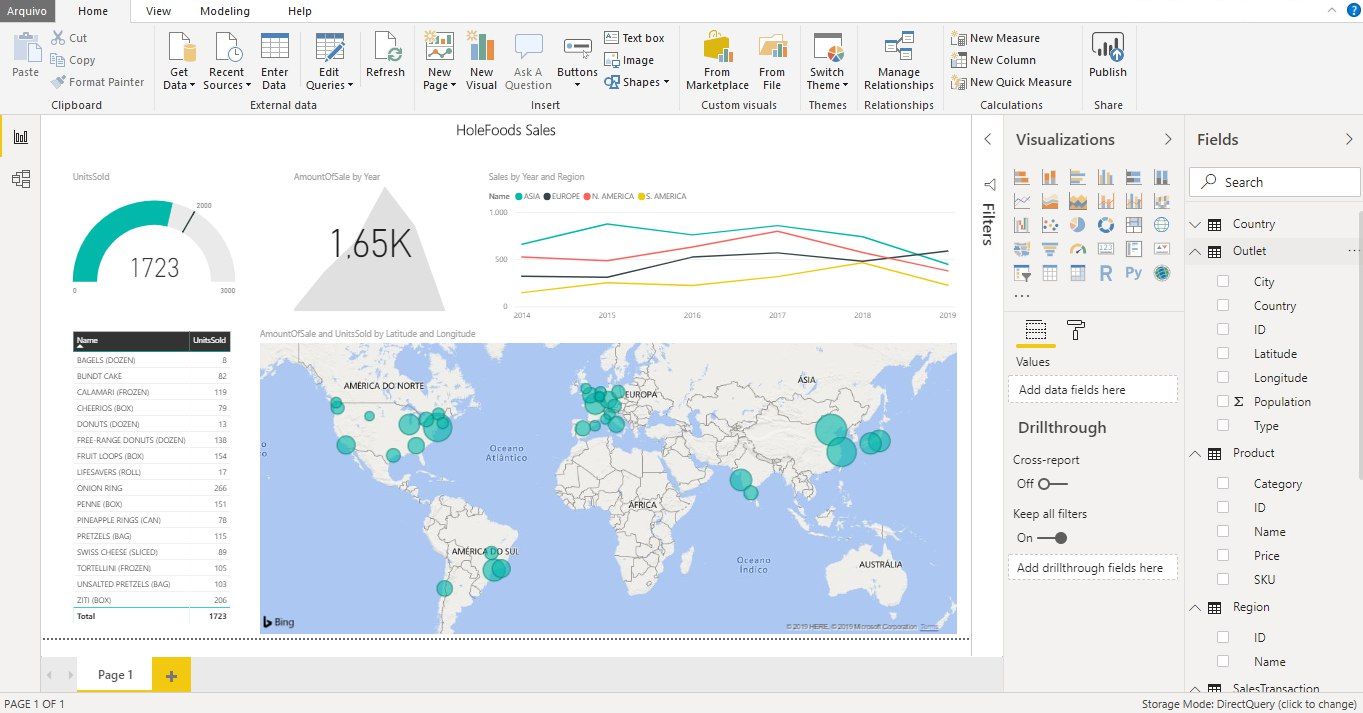
Microsoft Power BI is one of the industry’s leading business intelligence tools. With just a few clicks, Power BI makes it easy for managers and analysts to explore a company’s data. This is important because when data is easy to access and visualize, it’s much more like it’ll be used to make business decisions.
Hi Community,
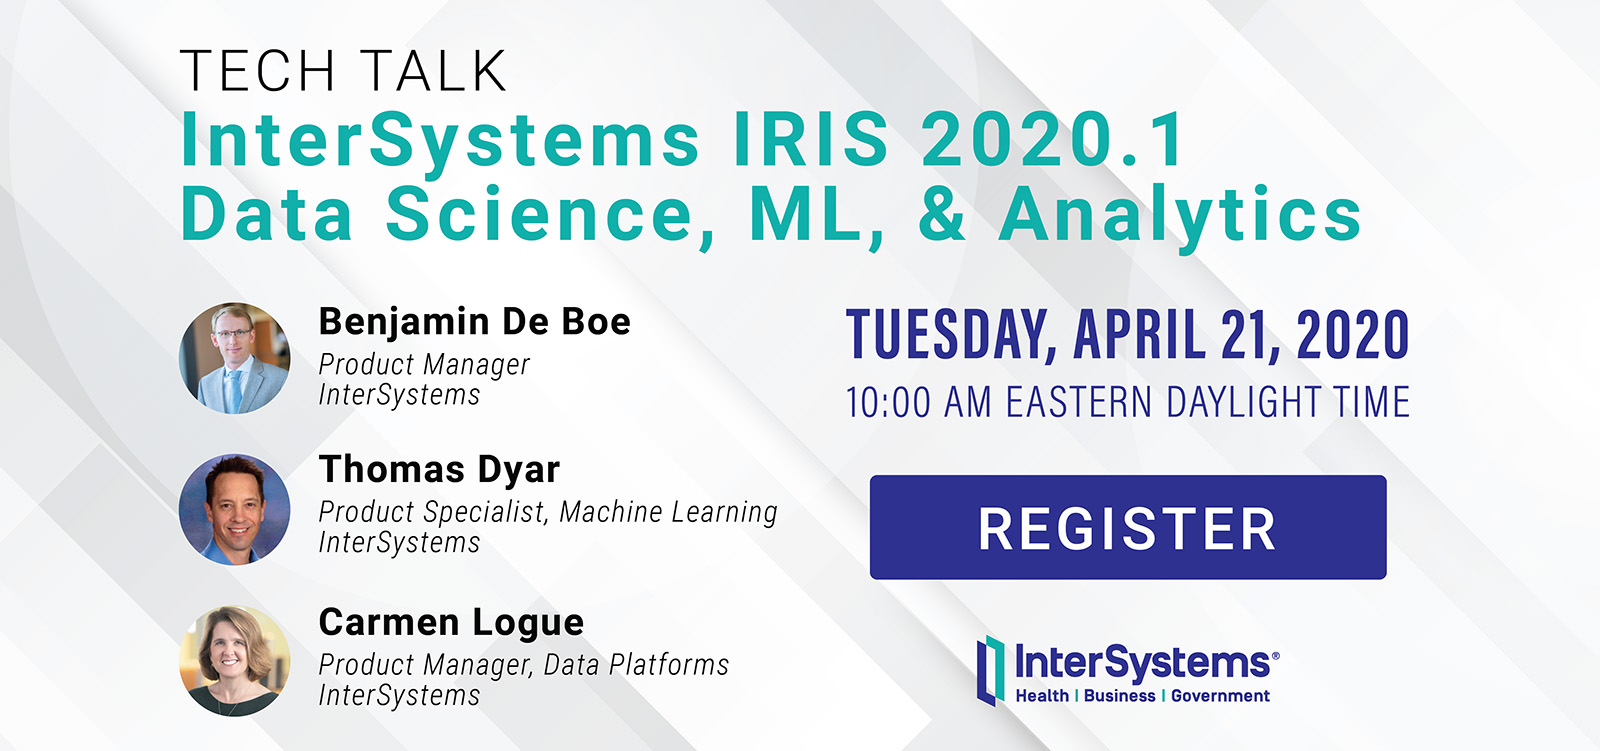
We're pleased to invite you to join the upcoming InterSystems IRIS 2020.1 Tech Talk: Data Science, ML & Analytics on April 21st at 10:00 AM EDT!
In this first installment of InterSystems IRIS 2020.1 Tech Talks, we put the spotlight on data science, machine learning (ML), and analytics. InterSystems IntegratedMLTM brings automated machine learning to SQL developers. We'll show you how this technology supports feature engineering and chooses the most appropriate ML model for your data, all from the comfort of a SQL interface. We'll also talk about what's new in our open analytics offerings. Finally, we'll share some big news about InterSystems Reports, our "pixel-perfect" reporting option. See how you can now generate beautiful reports and export to PDF, Excel, or HTML.
In Episode 7 of Data Points, product manager @Carmen Logue joined the pod to tell us all about InterSystems Reports — the new reporting feature of InterSystems IRIS! Take a listen to hear about its capabilities, use cases, and how it fits into the existing set of analytics technologies.
I'm happy to announce the release of the interface to Julia programming language for InterSystems IRIS. Execute Julia code and more from InterSystems IRIS. This project brings you the power of Julia right into your InterSystems IRIS environment:
Julia Gateway is a community project, available on OpenExchange
Hi-
I am trying to create a named filter in analyzer that filters for encounters that happened yesterday.
The UI only allows me to select the NOW member, and not NOW-1
Where is this named filter stored, and can I edit the MDX expression to add -1 to the MDX?
There are several options how to deliver user interface(UI) for DeepSee BI solutions. The most common approaches are:
The 1st approach is good because of the possibility to build BI dashboards without coding relatively fast, but you are limited with preset widgets library which is expandable but with a lot of development efforts.
The 2nd provides you the way to use any comprehensive js framework (D3, Highcharts, etc) to visualize your DeepSee data, but you need to code widgets and dashboards on your own.
Today I want to tell you about yet another approach which combines both listed above and provides Angular based web UI for DeepSee Dashboards - DeepSee Web library.
This error is sometimes seen while viewing a listing in InterSystems IRIS Business Intelligence:
ERROR #5540: SQLCODE: -99 Message: User <USERNAME> is not privileged for the operation (4)
As the error suggests, this is due to a permission error. To figure out which permissions are missing/needed, we can take a look at the SQL query that is generated. We will use a query from SAMPLES as an example.
SELECT TOP 1000 %ID, DateOfSale, Outlet->City, %EXTERNAL(Channel) AS Channel, Product->Name AS Product, UnitsSold, AmountOfSale AS Revenue, (Discount * 100) || '%' AS Discount, Comment FROM HoleFoods.
Preview Mode was added to InterSystems IRIS Business Intelligence to give designers a quick view of what their resulting Pivot Table will look like without needing to wait for the results to fully execute. This can be beneficial when designing pivot tables because if you are dragging and dropping elements to see how they look/work in your pivot table and seeing if they have the desired data. Since you are exploring and designing, you don't necessarily care about the results at the moment, but you would still like to see how your table looks with the changes you have made.
Intersystems use JReport as their reporting framework.
Are there any free version available for developers to try it out? If yes, can I avail the link?
Is there any free trial version for 'DeepSee'? if yes, can I avail the link?
Thanks in advance for your feedback.
Hi Community,
The new video is available on InterSystems Developers YouTube Channel:
⏯ Collecting Healthcare Data with Alexa
AnalyzeThis is a tool for getting a personalized preview of your own data inside of InterSystems BI. This allows you to get first hand experience with InterSystems BI and understand the power and value it can bring to your organization. In addition to getting a personalized preview of InterSystems BI through an import of a CSV file with your data, Classes and SQL Queries are now supported as Data Sources in v1.1.0!
Hello Community,
Thank you all for your continued feedback and support of our ad hoc reporting platform, VDM. There's been some questions around setting up a non-ODBC connection for InterSystems platforms. We published a new YouTube video showing the steps necessary to connect to InterSystems Caché and InterSystems IRIS with BridgeWorks VDM.
DeepSeeButtons is available on Open Exchange! This tool will generate a diagnostic report of your DeepSee environment.
The report consists of multiple sections. These sections range from System Details to Caché/InterSystems IRIS logs to Cube information. In addition to simply providing information about the environment, some common recommended configurations are checked. If a recommended configuration is not used, an alert is displayed highlighting that the environment configuration does not match the recommended configuration.
Hi there,
We need your help, in the build pivot with DMX, we don't can run the pivot. The MDX use is:
WITH MEMBER [Measures].[CondicionesContCompleta] AS ( IIf([Measures].[CondicionesContCompleta] = Null, 0,[Measures].[CondicionesContCompleta] ) ) SELECT NON EMPTY ( [Gerencia].Gerencia].[Gerencia] ) ON ROWS, NON EMPTY ( [Measures].[CondicionesContCompleta] ) ON COLUMNS FROM [Condiciones]
and when we executed the pivot display the next dialog.
Error#5001: Expected operator within tuple: ('SELECT' @pos 156)(2)
In the previous part of this series, we saw how to include data in a portlet from within DeepSee. This used the built in data controller. In this part, we are going to be pulling in data from outside of DeepSee. This will include both information from within InterSystems IRIS and from the OS.
This is useful if you would like to create a dashboard that only contains information about your system. It is also useful if you want to display data about your system along side data that you have stored in DeepSee.
When using Related Cubes in InterSystems IRIS BI, cubes must be built in the proper order. The One side must be built before the Many side. This is because during build time for the Many side, it looks up the record on the One side and creates a link. If the referenced record is not found on the One side, a Missing Relationship build error is generated. The One side is going to be the independent side of the relationship, AKA the side of the relationship that is referenced by the Many side or the Dependent cube. For example: Patients contain a reference to their Doctor.
%SQLRESTRICT is a special %FILTER clause for use in MDX queries in InterSystems IRIS Business Intelligence. Since this function begins with %, it means this is a special MDX extension created by InterSystems. It allows users to insert an SQL statement that will be used to restrict the returned records in the MDX Result Set. This SQL statement must return a set of Source Record IDs to limit the results by. Please see the documentation for more information.
This is useful because there are often times users want to restrict the results in their MDX Result Set based on information that is not in their cubes. It may be the case that this information may not make sense to be in the cube. Other times this can be useful when there is a large set of values you want to restrict. As mentioned before, this is not a standard MDX function, it was created by InterSystems to handle cases were queries were not performing well or cases that were not easily solved by existing functions.
In the previous part of this series, we saw how to reference a web page that will enhance our dashboard experience. Now we will look into referencing data that is already in our cubes.
In this example, we will be referencing the controller object and we will be extracting data from it. This data will then be displayed as text in our Dashboard. In Part 5, we will show how to incorporate this data into other charting libraries.
The controller object contains data from an MDX result set.
Hi Community,
The new video from Global Summit 2019 is already on InterSystems Developers YouTube:
⏯ InterSystems IRIS Roadmap: Analytics and AI
