Article
· Aug 31, 2016 1m read
DeepSee cubes building troubleshooting

Hi!

Sometimes you see that call to DeepSee cube building method:

w ##class(%DeepSee.Utils).%BuildCube("CubeName")

does nothing.

Here are my 2 cents on possible reasons.

1. Run DeepSee Reset method in certain Namespace:

NAMESPACE> w ##class(%DeepSee.Utils).%Reset()

and try again.

2. Make sure, that all the indices in your base class for the cube are rebuilt, rebuild them and run it again:

1 2
0 393

I know per documentation (pasted below) to set the DSTIME parameters for the base class of a cube. If that base class has a property that is another class, do I have to add the DSTIME parameters to that secondary class?

Documentation says the following in a section titled "Enabling Cube Synchronization:"

Before you can synchronize a cube, you must enable the cube synchronization feature for that cube. To do so:

0 3
0 510

Hi, Community!

You know, that when we build hierarchies in DeepSee dimension all the members of lower level should be the part of one member of the higher level.

If not you'll get some empty results in MDX queries with this hierarchy.

With Time dimensions the obvious valid hierarchy is Year->Month->Day, cause every Month consists of one Year and every day consists of one month.

2 3
0 406

I have a DeepSee KPI defined based on %DeepSee.KPI following the documentation http://docs.intersystems.com/latest/csp/docbook/DocBook.UI.Page.cls?KEY=.... I've then enabled the KPI on a dashboard by adding a Widget where the data source is the KPI. Currently the ability to show a Detail Listing is implemented by the call back %OnGetListingSQL. This method documents the parameter

1 2
0 325

Today my customer ask me a question about how to write the MDX with a summary row however this row with different aggregate functions for each column.

We know in DeepSee analyzer has pivot table option "Summary", user can select sum, avg ... aggregate functions to get the summary row/column. However we can not specify different aggregate function for each measure column.

Here show the example to use All level and IIF function achieve that. see the example (Holefood cube in Sample namespace) below

WITH MEMBER measures.[with avg summary info] AS

2 6
0 1.1K

I am trying to calculate a dimension percentage for WFRole on a child cube named MbMRouteHistoryInitiatorObj joined to a parent cube named MbmQaSObj by using a calculated member dimension within MbmQaSObj.

If I use the calculated member dimension value expression of [WFRole].[H1].[WFRole].CurrentMember/ [WFRole].[All WFRole].%ALL in the child cube MbMRouteHistoryInitiatorObj, the percentages work correctly.

0 6
0 466

I need to pass multiple values to a FILTER to a DeepSee DASHBOARD via the URL. The documentation seems to indicate this can be done, i.e.: "Where each filterspec is filter_name.filter_values" but there are no examples I can find that indicates what is used to separate multiple values. Say I want to pass the three values 5, 6, and 1395 to a filter. To pass just the 5 I know this works:

&SETTINGS=FILTER:LEAD.MYUSERID.H1.MYUSERID.5

but how do I include 6 and 1395. None of the following seem to work:

&SETTINGS=FILTER:LEAD.MYUSERID.H1.MYUSERID.5.6.1395

1 2
0 383

In DeepSee, having a customer account cube. The cube includes a time dimension AccountCreationDate.

How do you create a calculated measure to get the total number of accounts from the beginning to a certain date in abscissa ?

I tried many things including this:
AGGREGATE(%TIMERANGE([AccountCreationDate].[H1].[MonthYear].&[190001],[AccountCreationDate].[H1].[MonthYear].CURRENTMEMBER) ,[Measures].[%Count])

But I don't get the right result because the date in abscissa creates a filter on the first date.

1 2
0 858
Question
· Jun 2, 2016
Filtering a Filter

What would be the easiest or best way to filter the options presented by a filter control?

For example, suppose that I create a query using HoleFoods that uses a named filter to filter the product categories according to some criteria. When I display the query on the dashboard, I would like to provide a filter control that will allow users to further constrain the product categories. However, a simple filter control will display all the product categories available in the cube many of which are irrelevant to the current query.

Thanks for your help!

0 3
0 375
Article
· May 28, 2016 3m read
DeepSee Listing Groups

This article is about DeepSee Listing Groups, a new DeepSee feature that was introduced in release 2015.2.

DeepSee Listings have always been a part of DeepSee. DeepSee Listing Groups provide increased flexibility by allowing you to create new DeepSee Listings without modifying the cube definition.

3 3
0 282

Hello there Intersystems Developer Community,

This year while at the Global Summit, I came to learn of a component that Stephen Morrison of Intersystems had written that was capable of infusing SVG content into a PDF document. Apparently Stephen was approached about this and was amenable to sharing the code with us as we have recently encountered a similar need. I'm hoping this post will lead to the sharing of this utility code, so that we can determine if it will indeed suit our need.

0 2
0 427

Hi all,

I have a dashboard which shows the growth of the months compared with the month from the last year.

The way I found to develop that, it was with a kpi. So, I overrode the %OnLoadKPI method with two mdx:

SELECT NON EMPTY [DataD].[H1].[MothYear].Members ON ROWS, [Measures].[CountVisits] ON COLUMNS FROM SubjectAtendimento %FILTER [DataD].[H1].[Year].&[2016]

SELECT NON EMPTY [DataD].[H1].[MonthYear].Members ON ROWS, [Measures].[CountVisits] ON COLUMNS FROM SubjectAtendimento %FILTER [DataD].[H1].[Year].&[2015]

1 5
0 391

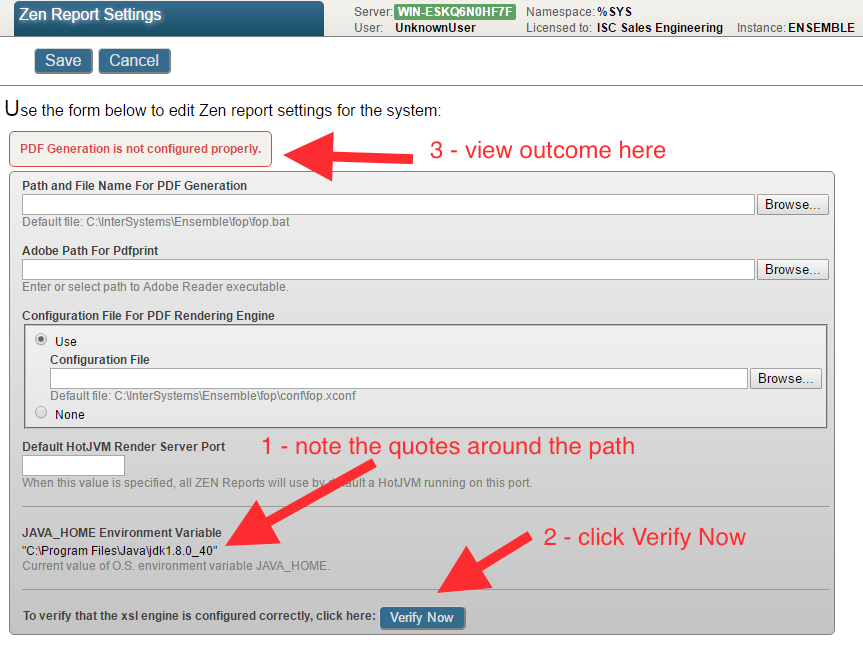
You may experience errors executing Java programs that rely on the JAVA_HOME environment.

For example when Create PDF from this pivot in DeepSee or in this case, outputting a Zen Report as PDF.

You can verify the PDF generation configuration by clicking on the Verify Now button on the Management Portal System > Configuration > Zen Report Settings page:

1 0
0 831

Presenter: Joe Gallant
Task: Create a good analytical data model
Approach: Discuss what makes a good analytical data model. Provide examples of using DeepSee’s APIs for building custom dimensions, measures, and KPIs

Data models are the foundation of effective analytics. This session focuses on the factors that make good analytics data models.

Content related to this session, including slides, video and additional learning content can be found here.

0 1
0 249

Presenter: Barry Cooper
Task: Enable users to perform analytics within an application and take actions based on those analytics
Approach: Provide examples of embedding DeepSee within applications

Analytics is more than just using data to provide insight. Analytics is about taking action on that insight. See examples of how you can embed DeepSee in your applications, allowing you to take action.

Content related to this session, including slides, video and additional learning content can be found here.

0 0
0 163

Presenter: André Cerri
Task: Use third-party visualization tools to present your DeepSee data
Approach: Use DeepSee REST services to access DeepSee data from third-party tools

Come see examples of how you can use popular 3rd party data visualization tools to access your DeepSee data.

Content related to this session, including slides, video and additional learning content can be found here.

0 0
0 255