InterSystems Business Intelligence enables you to embed business intelligence (BI) into your applications so that your users can ask and answer sophisticated questions of their data. Specifically, your application can include dashboards, which can include the following:
Interactive widgets that execute queries designed for specific user roles or for specific areas of your user interface.
Controls such as drop-down lists and data choosers that enable users to modify these queries.
Interactive drill options that enable users to view the displayed data in different ways.
Options to export, print, and send alerts to other users.
An option to launch the Mini Analyzer, which supports free-form analysis.
Execute custom actions that are provided as buttons or other controls.
In contrast to traditional BI systems that use static data warehouses, Business Intelligence is kept closely in synchronization with the live transactional data, as required for your business.
Now available on Open Exchange is a library of third party charts available to use within DeepSee/InterSystems IRIS BI dashboards. To start, simply download and install, select the new portlet as the widget type, then select the chart type that you desire. If you don't find the type of chart you are looking for, you can easily extend the portlet to implement your desired chart type. These new chart types can be used within existing dashboards or you can create new dashboards using them.
Last weekend I had been testing the newborn csvgen module and was looking for a CSV file to test - thus I came across an interesting datafile on Data.World with Game of Throne episodes statistics. Death statistics. These folks documented all the murders through all the 8 seasons and noted where, who, from what clan with what weapon had killed another one.
So I imported it and made an IRIS Analytics dashboard.
Don't worry, Jon, with this dashboard we can figure out something ). See the details below.
As the title mentions, I'm trying to determine how best to handle an issue with nested data. Essentially I have a setting like the following:
Object A has a transient property with an array of Object B. I want to create a level with a list of Object B. I also want this level to contain properties belonging to each object B.
Has anybody tried to extend the Menu on Management Portal? I like to add a new page or a dashboard that will be created soon to the Management Portal and allow others to use it also. I understand there are risks that I could lose things during an upgrade. I am okay with that. Does InterSystems support such an effort?
Surely there is an easy way to invoke a ClassMethod from a DeepSee detail listing line, in a similar way to launching a URL. In this case I need to do a little preprocessing of a request adding a SAML token.
I thought I knew how to do it long ago, but I can't read my faded notes on that old parchment.
I'm looking for a means to dynamically specify and/or limit the data from the source that goes into a cube at build time.
I have a single data class that defines my source, and as the data within this table/collection grows/changes over time, I would like to be able to control which records actually make it into the indexed cube, but I'm having a hard time (short of defining a stored procedure to use instead of the extent query) for populating my cube indexes.
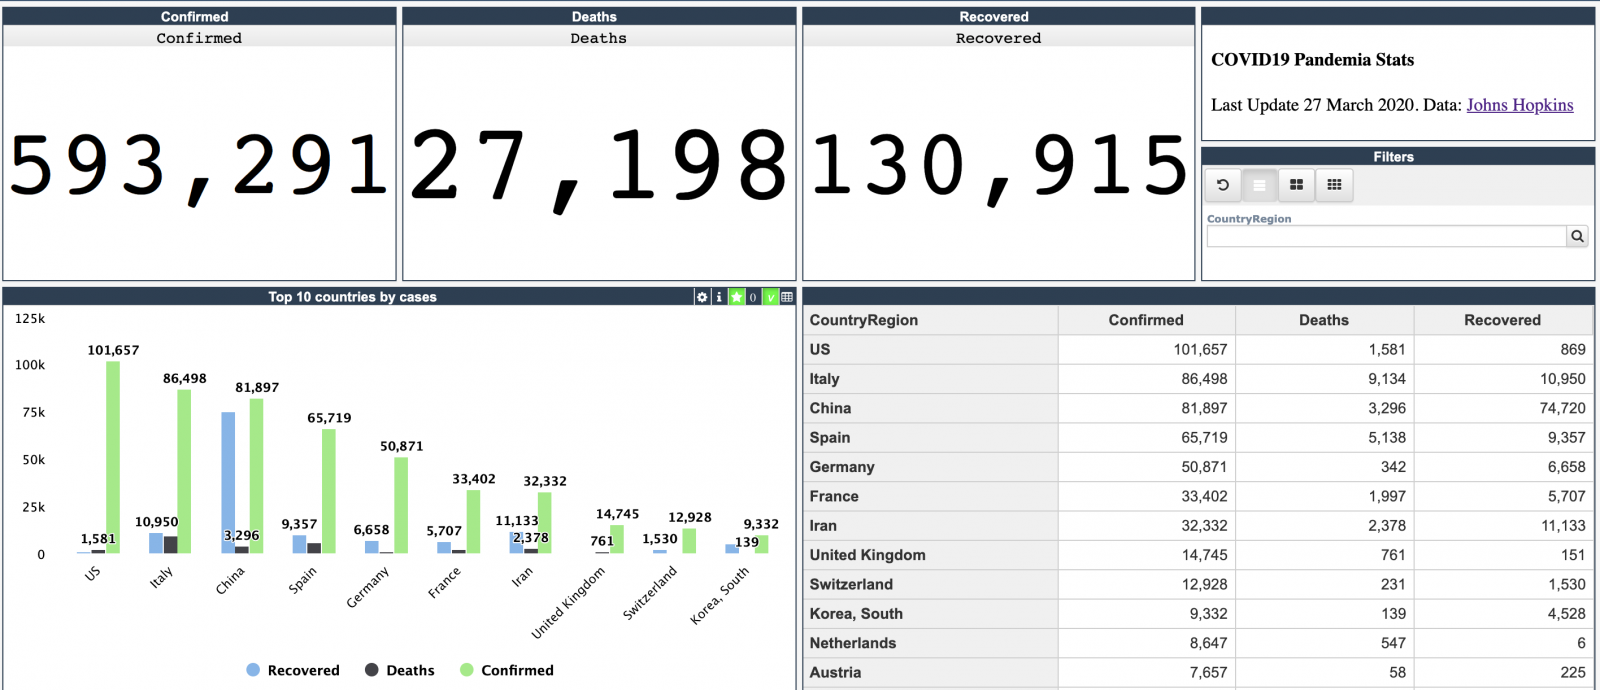
Every day Johns Hopkins University publishes new data on coronavirus COVID-19 pandemic status.
I built a simple InterSystems IRIS Analytics dashboard using InterSystems IRIS Community Edition in docker deployed on GCP Kubernetes which shows key measures of the disease outbreak.
This dashboard is an example of how information from CSV could be analyzed with IRIS Analytics and deployed to GCP Kubernetes in a form of InterSystems IRIS Community Edition.
InterSystems IRIS Business Intelligence allows you to keep your cubes up to date in multiple ways. This article will cover building vs synchronizing. There are also ways to manually keep cubes up to date, but these are very special cases and almost always cubes are kept current by building or synchronizing.
This error is sometimes seen while viewing a listing in InterSystems IRIS Business Intelligence: ERROR #5540: SQLCODE: -99 Message: User <USERNAME> is not privileged for the operation (4)
As the error suggests, this is due to a permission error. To figure out which permissions are missing/needed, we can take a look at the SQL query that is generated. We will use a query from SAMPLES as an example.
Preview Mode was added to InterSystems IRIS Business Intelligence to give designers a quick view of what their resulting Pivot Table will look like without needing to wait for the results to fully execute. This can be beneficial when designing pivot tables because if you are dragging and dropping elements to see how they look/work in your pivot table and seeing if they have the desired data. Since you are exploring and designing, you don't necessarily care about the results at the moment, but you would still like to see how your table looks with the changes you have made.
I am moving some DeepSee components to another environment and would like to know if the pivots and dashboards have to reside in the "Other" branch of the Workspace in Studio.
I need to convert a JSON payload to a custom object type. Currently, I'm converting the JSON object to a %Library.DynamicObject object and need to proceed from here.
As of now, these are my options
1. Using an external library talked about in this link:
Hi there, We need your help, in the build pivot with DMX, we don't can run the pivot. The MDX use is:
WITH MEMBER [Measures].[CondicionesContCompleta] AS ( IIf([Measures].[CondicionesContCompleta] = Null, 0,[Measures].[CondicionesContCompleta] ) ) SELECT NON EMPTY ( [Gerencia].Gerencia].[Gerencia] ) ON ROWS, NON EMPTY ( [Measures].[CondicionesContCompleta] ) ON COLUMNS FROM [Condiciones]
and when we executed the pivot display the next dialog.
Error#5001: Expected operator within tuple: ('SELECT' @pos 156)(2)
Many of you are looking for samples on how to work with InterSystems IRIS Analytics, formerly known as DeepSee.
There is a Samples BI module with Patients and Holefoods examples which is available on Github with source code. The installation steps are clear but take time.
Recently we added the option to run IRIS Community Edition containers with ObjectScript Package Manager (ZPM) on board. This simplifies the installation to the "run-one-command" step for the modules submitted to ZPM Community Registry. And thus we can benefit the Samples BI installation with ZPM.
And here is how you can run it on your laptop. Let's go!
Hi All,
We have been using DeepSee which has been the integrated Analytic Dashboard built over Cache Cubes. It works fine but it's visual capabilities are limited and most probably is getting phased out.
If I am not wrong, Tableau is the suggested alternative to DeepSee . It is expensive and a big and considerable shift from existing technology
I wanted to get an opinion of the community as to these few key points
- What other BI tools others have been using with IRIS and what have been their experience
- For which tools are the best inbuilt support / api's avaialble in IRIS
In the previous part of this series, we saw how to include data in a portlet from within DeepSee. This used the built in data controller. In this part, we are going to be pulling in data from outside of DeepSee. This will include both information from within InterSystems IRIS and from the OS.
Why use this?
This is useful if you would like to create a dashboard that only contains information about your system. It is also useful if you want to display data about your system along side data that you have stored in DeepSee.
When using Related Cubes in InterSystems IRIS BI, cubes must be built in the proper order. The One side must be built before the Many side. This is because during build time for the Many side, it looks up the record on the One side and creates a link. If the referenced record is not found on the One side, a Missing Relationship build error is generated. The One side is going to be the independent side of the relationship, AKA the side of the relationship that is referenced by the Many side or the Dependent cube. For example: Patients contain a reference to their Doctor.
%SQLRESTRICT is a special %FILTER clause for use in MDX queries in InterSystems IRIS Business Intelligence. Since this function begins with %, it means this is a special MDX extension created by InterSystems. It allows users to insert an SQL statement that will be used to restrict the returned records in the MDX Result Set. This SQL statement must return a set of Source Record IDs to limit the results by. Please see the documentation for more information.
Why is this useful?
This is useful because there are often times users want to restrict the results in their MDX Result Set based on information that is not in their cubes. It may be the case that this information may not make sense to be in the cube. Other times this can be useful when there is a large set of values you want to restrict. As mentioned before, this is not a standard MDX function, it was created by InterSystems to handle cases were queries were not performing well or cases that were not easily solved by existing functions.
In the previous part of this series, we saw how to reference a web page that will enhance our dashboard experience. Now we will look into referencing data that is already in our cubes.
In this example, we will be referencing the controller object and we will be extracting data from it. This data will then be displayed as text in our Dashboard. In Part 5, we will show how to incorporate this data into other charting libraries.
In the previous part of this series, we saw how to define a basic portlet. Now we will look into making this portlet reference a web page that will enhance our dashboard experience.
In this example, we will be embedding a Developer Community article along side a couple of widgets displaying information related to the number of views on the Developer Community articles. This example is not hosted on the Community Analytics server, but if it was we could see the view counts going up as we interacted with the page.
Why use this?
In a real case, perhaps you have an embedded page from an external web site showing the current Emergency Room wait times for Hospitals in your area. This portlet can be used along side widgets from your Emergency Room showing how many people are waiting, how many doctors are active, and how many people are being treated. As other Emergency Room wait times grow, you can possibly expect your volume to increase as well. This can help you make decisions on how to allocate resources.
The simple answer is: a custom widget. A portlet can exist by itself on a DeepSee dashboard, it can be used along side standard DeepSee widgets, or along side other portlets. The rendering of the custom widget is completely user defined. This means you can embed a web page, create a form to perform any sort of action needed based on the data on your dashboard, use third party charting libraries, or simply display data from outside of a DeepSee cube.
When designing a hierarchy in DeepSee, a child member must have only one parent member. In the case where a child corresponds to two parents, the results can become unreliable. In the case where two similar members exist, their keys must be changed so that they are unique. We will take a look at two examples to see when this happens and how to prevent it.
 By date
 Open Exchange app
.png)