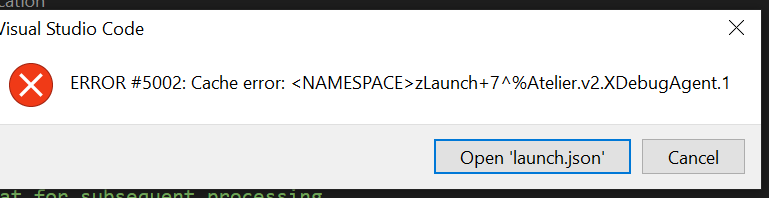
Debugging is the process of finding and resolving defects or problems within a computer program that prevents the correct operation of computer software or a system.
Is CR/LF changes to DTL files edited/committed to git via VS Code a known issue?
We had an issue with exporting files from one server and importing on another, using XML code exported from Studio: ERROR #6301: SAX XML Parser Error. Turns out that issue was down to CR/LF changes made when transferring the XML from one server to the other.
I'm trying to make a REST API call in JSON format. When using the example in the class reference documentation the getJSON method in the %Net.Http class throws the error <METHOD DOES NOT EXIST> on a %Clone() method in the %LIbrary.DynamicObject class. I even changed the parameter to a JSON string to no avail. The code will then fail on the %Compose method (examples below). My workaround is to use the %Net.HttpRequest functionality. Is there another workaround to this?
While I love using VSCode for IRIS development work, one of the persistent frustrations with it has been the inability to display an object hierarch in the variables window while debugging. Only the object's reference identifier is displayed. Cache Studio's handling of the same issue is a little clunky, but it does at least have the option to display something as an object.
For now, I make do with a combination of the watch window and the command line in the debugging console -- but this feels just a step away from log.debug()/console.log() level debugging sometimes.
I'm at a loss with configuring the IRIS ODBC driver (v02.10) on my Amazon Linux machine, connecting to a REMOTE IRIS backend. It should be simplified by not requiring a DSN (the app uses a DSN-less connection and generates the connection string). I have
I am experiencing a problem with an EDI process that uses a SQL Batch Service to connect to our DEV environment. However, when we point the EDI service to our TEST server, it errors out.
I have checked every single property on our TEST and DEV servers as well as the properties on the associated tables. They are identical. Nothing has changed in the SQL either.
I'm facing an issue while converting an ORU_R01 HL7 message to XML, specifically with the <pidgrpgrp> kind elements. When I use the getvalueat() method before conversion, the XML includes the <pidgrpgrp> and other <grp> elements, but when I don't use the getvalueat() method, the XML is generated without these <grp>elements.
I have a couple of IOT devices that communicate via WebSockets to our backend.
I successfully managed to create a websocket connection between server and (iot)client using %CSP.WebSocket However I would like to implement authentication on this using the HTTP headers at the same time of Connection: Upgrade.
I tried to set the headers to globals in order to debug but they are always empty.
Exported contents of a namespace on one server (classes, include files and lookup tables). Importing that code into a newly created namespace on another server. Both servers Ensemble 2018.1, same build. Export was via InterSystems Studio. Export is around 18Mb in total (XML file sizes).
When importing and compiling on the new server, getting errors as below - with #6301: SAX XML Parser error prominent - on a number of the imported files, all containing data transformations or business processes.
Hello, I'm trying to debug web app in Atelier remotely.
In Studio I could use "Set as debug target" option for this purposes. The class launches with CSPDEBUG option in browser and everything goes fine. But I can't find how to do this in Atelier.
Hi I am trying to run a debugger in VS Code. I have the settings.json file and the launch.json file. I am trying to debug code using the attach to a process method, however when I run the debugger I get the following error.
Launch.json code
{
// Use IntelliSense to learn about possible attributes.
// Hover to view descriptions of existing attributes.
I have an existing application on HealthShare 2015 and decide to move it to HealthShare 2018 to make use of Atelier support. I am using Eclipse Photon with Atelier Plugin 1.3.
Most of things are working better on Atelier comparing with Built-in studio of HealthShare. However, when I tried debugging CSP file with Atelier I encounter 2 problems:
In case of system exception (missing property, method etc) Cache Studio's debugger stops at the line throwing it. Unless the line is in try/catch block.
Is there a way to make it break also in try/catch case?
Someone may have asked this before but is there a way to return the TRACE statements that we have placed in the Data transformation within the DTL Editor Testing Tool (EnsPortal.Dialog.TestTransform.cls)? Is this something we can get in an Enhancement request in for?
It would save sometime in troubleshooting where an error might be in the DTL.