Hi Developers!
We had a set of technology bonuses for the InterSystems IRIS Analytics contest.
And here is how projects collected it:
This tag relates to the discussions on the development of analytics and business intelligence solutions, visualization, KPI and other business metrics management.
Hi Developers!
We had a set of technology bonuses for the InterSystems IRIS Analytics contest.
And here is how projects collected it:
Previously I have already tried to play with Google Data Studio when I connected it to InterSystems FHIRaaS. It has quite a nice UI, with a few chart types available out of the box, it can be quite easily connected to some plain tables (stored as CSV or JSON, for instance), and gives the ability to build quite flexible analytics over it. So, I have decided to implement a new connector to InterSystems Analytics (DeepSee), with the ability to select a cube and do some queries on it.
.png)
The OKR methodology (Objectives and Key Results or Objectives and Key Results) is used by the largest companies in the world (such as Google, Netflix, Spotify, BMW, Linkedin, etc.) for agile performance management. It was created in the 1970s by Andrew Grove, president of Intel, and introduced to the general public in his famous book “High Output Management”.
Around 1998 John Doerr, one of the world's top venture capitalists, after coming into contact with Intel's OKR, introduced the model to Larry Page and Sergey Brin, who started a small company called Google.
Hey Developers,
Welcome to the next InterSystems online programming competition:
🏆 InterSystems IRIS Analytics Contest 🏆
Duration: August 23 - September 12, 2021
Total prize: $8,750
Landing page: https://contest.intersystems.com
Hey Developers,
Learn about InterSystems Reports, powered by Logi Analytics, a report-generation tool that enables you to rapidly create and view visual reports of your data.
Hi Developers!
Here're the technology bonuses for the InterSystems Analytics contest that will give you extra points in the voting.
Adaptive Analytics (AtScale) Cubes usage - 4 points
InterSystems Adaptive Analytics provides the option to create and use AtScale cubes for analytics solutions.
You can use the AtScale server we set up for the contest (URL and credentials can be collected in the Discord Channel) to use cubes or create a new one and connect to your IRIS server via JDBC.
The visualization layer for your Analytics solution with AtScale can be crafted with Tableau, PowerBI, Excel, or Logi.
Hi Community,
We are pleased to invite all the developers to the upcoming InterSystems Analytics Contest Kick-off Webinar! The topic of this webinar is dedicated to the Analytics contest.
On this webinar, we’ll demo AtScale, InterSystems Reports (Logi), IRIS BI, IRIS NLP and answer the questions on how to develop, build, and deploy Analytics applications using InterSystems IRIS.
Date & Time: Monday, August 23 — 10:00 AM EDT
Speakers:
🗣 @Carmen Logue, InterSystems Product Manager - Analytics and AI
🗣 @Evgeny Shvarov, InterSystems Developer Ecosystem Manager
Hi developers!
How to build an analytics solution with InterSystems IRIS?
To begin with, let's agree on the points of what is the analytics solution - and this could be a very wide topic. Let's limit the set of solutions to those you can present in the Analytics contest.
There are three kinds of analytics solutions that we will review here: monitoring, interactive analytics, and reporting.
Monitoring
The typical monitoring solution consists of an online dashboard with KPIs that are being actively updated.
The key use case is of monitoring is to visually observe the KPI of fresh data every moment to react in case of an emergency.
Interactive Analytics
This solution supposes a set of interactive dashboards with filters and drill-downs.
The key use case is to explore the data with filters and drill-downs making business decisions upon graph and table data visualization.
Reporting
Reporting solution provides a set of static (usually) reports in a form of HTML or pdf documents that deliver the data in graph and text form in a predesigned form and could be sent via email.
The typical use case of a reporting system is to obtain reports on a given period that will illustrate the status of the product, process, service, sales, etc that is crucial for the business.
How InterSystems products could be used to build such solutions? Let's discuss this below!
Hi Community,
See a demonstration of InterSystems IRIS Adaptive Analytics and get a detailed description of this new offering for analytics end-users:
Hey Developers,
Watch the new video on InterSystems Developers YouTube:
Sometimes you when create a pivot in Analyzer and see the result that shouldn't exist - don't run to create a WRC ticket, try to call the IRIS BI reset function first:
d $System.DeepSee.Reset(1)And in many cases this will solve the problem.
And if it doesn't help, create a WRC ticket )
I work on an ERP system and am trying to set up a dashboard according to a customer request. It's a pivot table with a few controls and filters, nothing too difficult, but I'm having some issues with drill down.
We've got item sales data. Quantity sold, sales dollars, cost, gross profit as both dollars and a percentage. It's starting out with one row per item. From there, we can drill down to see which salesmen have sold that item and get all of those numbers for each salesman.
Hi,
I am testing some BI tools like Tableau, Power BI and Qlik with Caché using ODBC driver
Is there another way to connect them with Caché?
When we have to predict the value of a categorical (or discrete) outcome we use logistic regression. I believe we use linear regression to also predict the value of an outcome given the input values.
Then, what is the difference between the two methodologies?
The release of InterSystems IRIS 2021.1 introduces Adaptive Analytics. To get started with a familiar InterSystems IRIS BI sample cube, we have created a HoleFoods Sample Application for Adaptive Analytics. This Sample Application is available on Open Exchange. There is also a learning services course available to learn more about Adaptive Analytics.
.png)
.png)
Gartner defined DataOps as: "A collaborative data management practice focused on improving the communication, integration and automation of data flows between data managers and data consumers across an organization. The goal of DataOps is to deliver value faster by creating predictable delivery and change management of data, data models and related artifacts. DataOps uses technology to automate the design, deployment and management of data delivery with appropriate levels of governance, and it uses metadata to improve the usability and value of data in a dynamic environment.
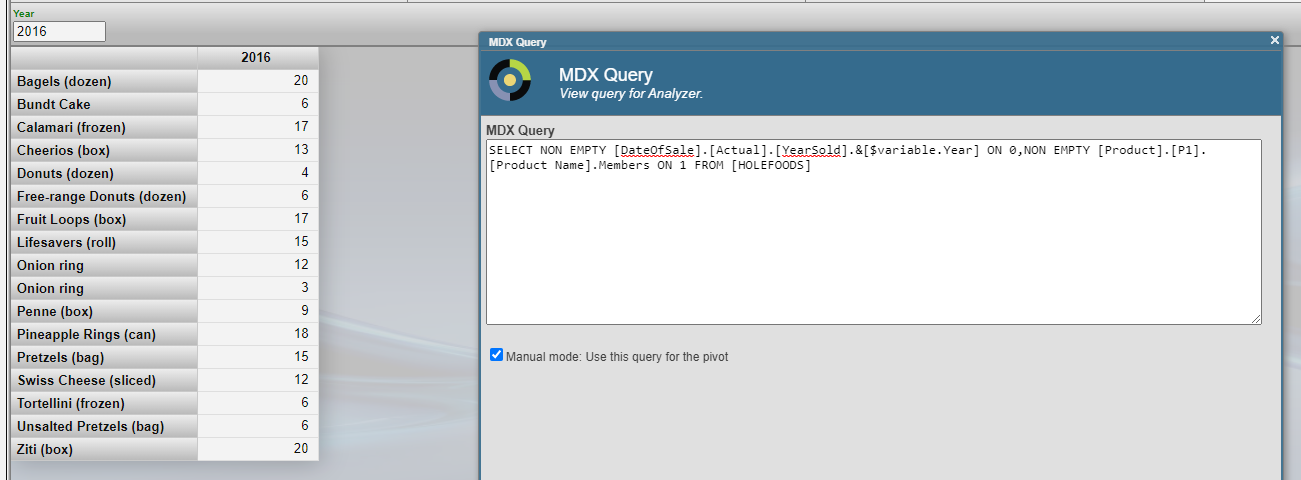
Is there a way to add/substract from a pivot variable?
I have this MDX:
SELECT
  NON EMPTY [DateOfSale].[Actual].[YearSold].&[$variable.Year] ON 0,
  NON EMPTY [Product].[P1].[Product Name].Members ON 1
FROM [HOLEFOODS]
And with pivot variable Year equal to, say, 2016 it works:
Now I want to add previous year first with one pivot variable and one explicit reference. It also works:
SELECT
  NON EMPTY
  {
    [DateOfSale].[Actual].[YearSold].&[$variable.Year],
    [DateOfSale].[Actual].[YearSold].&[2015]
  } ON 0,
NON EMPTY [Product].[P1].[Product Name].Is there a way in BI (DeepSee) to compare current value, to a value of a previous year?
For example I can hardcode this explicitly:
.png)
But I want in a widget to filter by year (1st column) and get the value for a previous year in a next column. YTY would be even better.
What MDX functions should I use? Examples?
When you have been using cubes for business intelligence in a namespace for some time, you may find that there are many cubes in the namespace, only some of which are actively being used. However, it can be difficult to tell which cubes users are or are not querying, and maintaining unused cubes can be costly both in terms of storage and of computation to keep them up to date. This article provides some suggestions and examples for monitoring which cubes are in active use, and for removing cubes that you determine are no longer necessary.
In this article we are going to show the results of the comparision between IRIS and Postgress when handling Astronomy data.
Since the earliest days of human civilization we have been fascinated by the sky at night. There are so many stars! Everybody has dreamed about them and fantasized about life in other planets.
Astronomers have been identifying and classifying stars since many centuries ago. There are star catalogues compiled in Mesopotamia and Egypt from the 2nd millennium BC [1]. In modern times there have been two main catalogues: Hipparcos [2] and Gaia [3].
Over the last couple of weeks the Solution Architecture team has been working to finish off our 2019 workload: this included open-sourcing the Readmission Demo that was brought to HIMSS last year, so we could make it available to anyone looking for an interactive-way of exploring the tooling provided by IRIS.
While in the process of open sourcing the demo we were immediately hit hard with a showstopper.
According to IDC, more than 80% of information it is NoSQL, especially text into documents. When the digital services or applications not process all this information, the business lose. To face this challenge, it is possible use OCR technology. OCR uses machine learning and/or trained image patterns to transform image pixels into text. This is important, because many documents are scanned into images inside PDF, or many documents contains images with text inside. So OCR are an important step to get all possible data from a document.
When creating pivots in DeepSee, there is the ability to group date dimensions by Day, Week, Month, Quarter, Year. For some of our reporting the Week option is desired. However the display looks like the image shown below. Notice the "YYYYW##" formatting.
Is there any ability within DeepSee to modify the display of grouped week dates? E.g. instead of 2020W14 it could be 03/30/2020-04/05-2020, or even just the start or end date, etc.
.png)
Episode 17 of Data Points features a roundtable conversation with Carmen Logue, Benjamin De Boe, and Thomas Dyar about the Analytics & AI area of the InterSystems technology stack. Learn from these product experts about the various technologies and partnerships that exist within the Analytics & AI space at InterSystems, how some customers use these tools, and what might be coming in the future.
Dear Folks,
I have recently studied deepsee and developed few dashboards needed for our web app users. I am trying to embed them in our existing web app which uses angular with delegated user access. I need to embed the native IRIS dashboard into it. ( I can't use Highcharts or any other js tools).
How do I setup the dashboards to work with delegated authentication (Without providing access to management portal or other parts) ? Also should I use the default csp/{Namespace}/_DeepSee.UserPortal.DashboardViewer.zen? or any other web application URL ?
Thanks
E.g. I want to add a button on a widget that will rebuild the cube when clicked.
How can I make it happen?
Hey Developers,
Enjoy watching this brief explanation of a new feature in IRIS RAD Studio – a new project by @José.Pereiraand @Henrique.GonçalvesDias:
@José Pereira and I created a good project, and we want to introduce a few words about this project to you.
IRIS RAD Studio is our idea of a low-code solution to show what's possible, to make the developer's life easier.
Hey Developers,
See how you can use InterSystems IRIS and Alteryx together to provide analytics and insights to your users.