Hi Developers,
Enjoy watching the new video on InterSystems Developers YouTube:
⏯ Analytics with InterSystems New and Next 2022 @ Global Summit 2022
This tag relates to the discussions on the development of analytics and business intelligence solutions, visualization, KPI and other business metrics management.
Hi Developers,
Enjoy watching the new video on InterSystems Developers YouTube:
⏯ Analytics with InterSystems New and Next 2022 @ Global Summit 2022
When we are at the starting stage of BI project development, we must remember that it is crucial to select the right tool for its implementation. Today we want to show you how one of the principal functionality of dashboards is implemented in different BI systems. Let's talk about drill down from both points of view: the dashboard development, and the convenience and clarity for the end user. We will touch on the applications of this technology in IRIS BI, Power BI and Tableau.
In IRIS BI, cubes initially provide hierarchies according to which drilldown will later occur.
InterSystems Developer Community analytics. Project made with InterSystems IRIS BI (DeepSee), Power BI and Logi Report Designer to visualize and analyze members, articles, questions, answers, views and other pieces of content and activity on InterSystems Developer Community.
You can see your own activity, articles and questions. Track how your contribution changes developer community.
Analyse statistics about you and your friends using IRIS BI, Adaptive Analytics, InterSystems Reports, Tableau and Power BI.
Hi All,
I have a method like this and I want to be able to see the results on the terminal, how do I run this method on a terminal to display the results of this SQL query?
Method ResponseTimeCurrentMonth(namespace)
{
set oldNamespace = $Namespace
new $Namespace
set $Namespace = namespace
s timeTaken = 0, InDate = ""
#SQLCompile Select=Display
&SQL(select InDate, AVG(Time_Taken) into :InDate, :timeTaken from (select SessionId, (TimeCreated) InDate, MIN(TimeCreated) Start_Time,MAX(TimeProcessed) End_Time, DATEDIFF('ms',MIN(TimeCreated),MAX(TimeProcessed)) Time_Taken FROM Ens.
In this article you will have access to the curated base of articles from the InterSystems Developer Community of the most relevant topics to learning InterSystems IRIS. Find top published articles ranked by Machine Learning, Embedded Python, JSON, API and REST Applications, Manage and Configure InterSystems Environments, Docker and Cloud, VSCode, SQL, Analytics/BI, Globals, Security, DevOps, Interoperability, Native API. Learn and Enjoy!
Machine Learning is a mandatory technology to build advanced data analysis and automate manual activities with excellent efficiency.
One of the most important tasks of dashboards is, on the one hand, to help you perceive data in an aggregated form, and, on the other hand, not to lose the depth of immersion in the data if you need this. One of the tools that help us achieve this result is drill down. It enables us to display several hierarchical levels of data, from aggregated to detailed.
Our task is to make an analytical dashboard that will be able to drill down by time periods: from months to weeks and days in each chart.
Hi guys,
Does rebuilding of Data Quality Manager cubes affect patient index linkage definition data?
What I want to understand is, does DQM have any negative impact on the data each time you rebuild the cubes.
Additionally, if I make changes to the cube and rebuild it..will this have any impact on the original data?
When we collect temporary data (the number of purchases in the store, the number of comments on the post), it may happen that there is no data for a certain period of time. In this case, this time period (hour, day, month) is not represented in the database, that is, there is not a single row for this period. In other words, there are no rows in the database for this period.
When we start building analytical reports based on data from IRIS or Adaptive Analytics cubes, a visualization problem appears.
I am receiving Mirroring updates to an IRIS for Health async reporting server and need to pause the mirroring journal processing to periodically quiesce the database to rebuild cubes and custom staging tables.
What API or web service can I use to quiesce the reporting server and then later initiate catch up?
Hi,
I have 3 simple tables: Encounter, Patient and Immunizations. Encounter makes a reference to Patient, and Patient contains a list of Immunization objects.
I've tried using PowerBI to access IRIS (using ODBC connector, not InterSystems BI connector), PowerBI reports the error:
Expression.Error: The column 'Patient' of the table wasn't found.
Details:
    Patient
it does this for two of the three tables I need only (Patient and Encounter), but not for Immunization IRIS table..
Anyone know why and how to fix ?
Thanks - Steve
Hey Developers,
New video is already on InterSystems Developers YouTube channel:
⏯ InterSystems HealthShare Analytics Solution: Create & Deliver Real-Time Insight at Scale
Hi All,
I am looking for a reporting tool (Analytics purpose) which can be built using cache object script/MUMPS. Basically my requirement is to find a tool where I can implement cache code to report data for my application.
I am unaware of DeepSee and how it works. Please assist for the same.
Hi Community,
New session recording from Global Summit 2019 is available on InterSystems Developers YouTube Channel:
I was using PowerBI to create regular display data obtained from one popular web sourse with hundreds of thousands of visitors per month and a big number of users.
At the beginning of that visualisation development, I was using direct connection from Power BI to Adaptive Analytics powered by AtScale. Adaptive Analytics is useful for cached data, aggregates and fast data sources switching between development and stage phases.

See what's new in InterSystems Learning Services! In the March 2022 newsletter, you will:
InterSystems IRIS Business Intelligence allows you to keep your cubes up to date in multiple ways. This article will cover building vs synchronizing. There are also ways to manually keep cubes up to date, but these are very special cases and almost always cubes are kept current by building or synchronizing.
The build starts by removing all data in the cube. This ensures that the build is starting in a clean state. The build then goes through all records specified by the source class.
Hi Community,
New video is already on InterSystems Developers YouTube:
Is there any open source tool like Power BI or Tableau that works well with IRIS? Thx!
i'm trying to extend both the MemberEnrollment and the MedicalClaim objects in HS. The CareProvider is perfect for some of my extensions (Operating provider, referring provider, third-party insurer), but the documentation says https://docs.intersystems.com/irisforhealthlatest/csp/docbook/DocBook.U…:
.png)
I need something that is just like a CareProvider, and I will be using the CarePRoviderType as a CodeTableDetail.
Why is CareProvider excluded? Does this mean I can't add property HS.Local.SDA3.MemberEnrollment.PHPProvider as HS.SDA3.CodeTableDetail.
When designing a hierarchy in DeepSee, a child member must have only one parent member. In the case where a child corresponds to two parents, the results can become unreliable. In the case where two similar members exist, their keys must be changed so that they are unique. We will take a look at two examples to see when this happens and how to prevent it.
There are a handful of states with a city named Boston. In my sample data, I have records from both Boston, MA and Boston, NY. My dimension is defined as: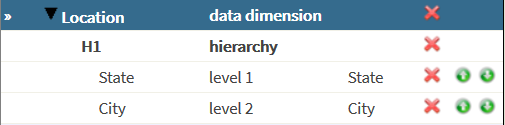
City and State are simply strings in my case.
Hey Community,
See how cubes are constructed for use in business intelligence, and learn about SQL and MDX query languages. Physical and virtual cubes are used in InterSystems IRIS® Business Intelligence and Adaptive Analytics:
Hi All,
We have been using DeepSee which has been the integrated Analytic Dashboard built over Cache Cubes. It works fine but it's visual capabilities are limited and most probably is getting phased out.
If I am not wrong, Tableau is the suggested alternative to DeepSee .
I have an SDA feed from an Edge server that eventually is fed into HSHI / Analytics. This edge server is loading up patient demographics (in the Patient object), which feeds the HSAA.Patient table in HSHI / Analytics.
However, we have other edge servers also feeding into the same HSHI database, and these other edge servers have better demographic information.
HSHI appears to use the most recent demographic information from all edges. What's the best way to de-prioritize patient demographic information from this particular edge (or this particular Facility) when feeding it into HSHI?
* In-Platform Agent-Based Simulation of a Connected Factory Cluster
Author: Sergey Lukyanchikov, InterSystems
In this paper we prototype and explore how multiple agent-based models of robotic factories connected to other robotic factories (represented by their respective models) can be orchestrated using an all-purpose data platform – thereby simulating descriptive and predictive properties of a group of factories (a factory cluster).
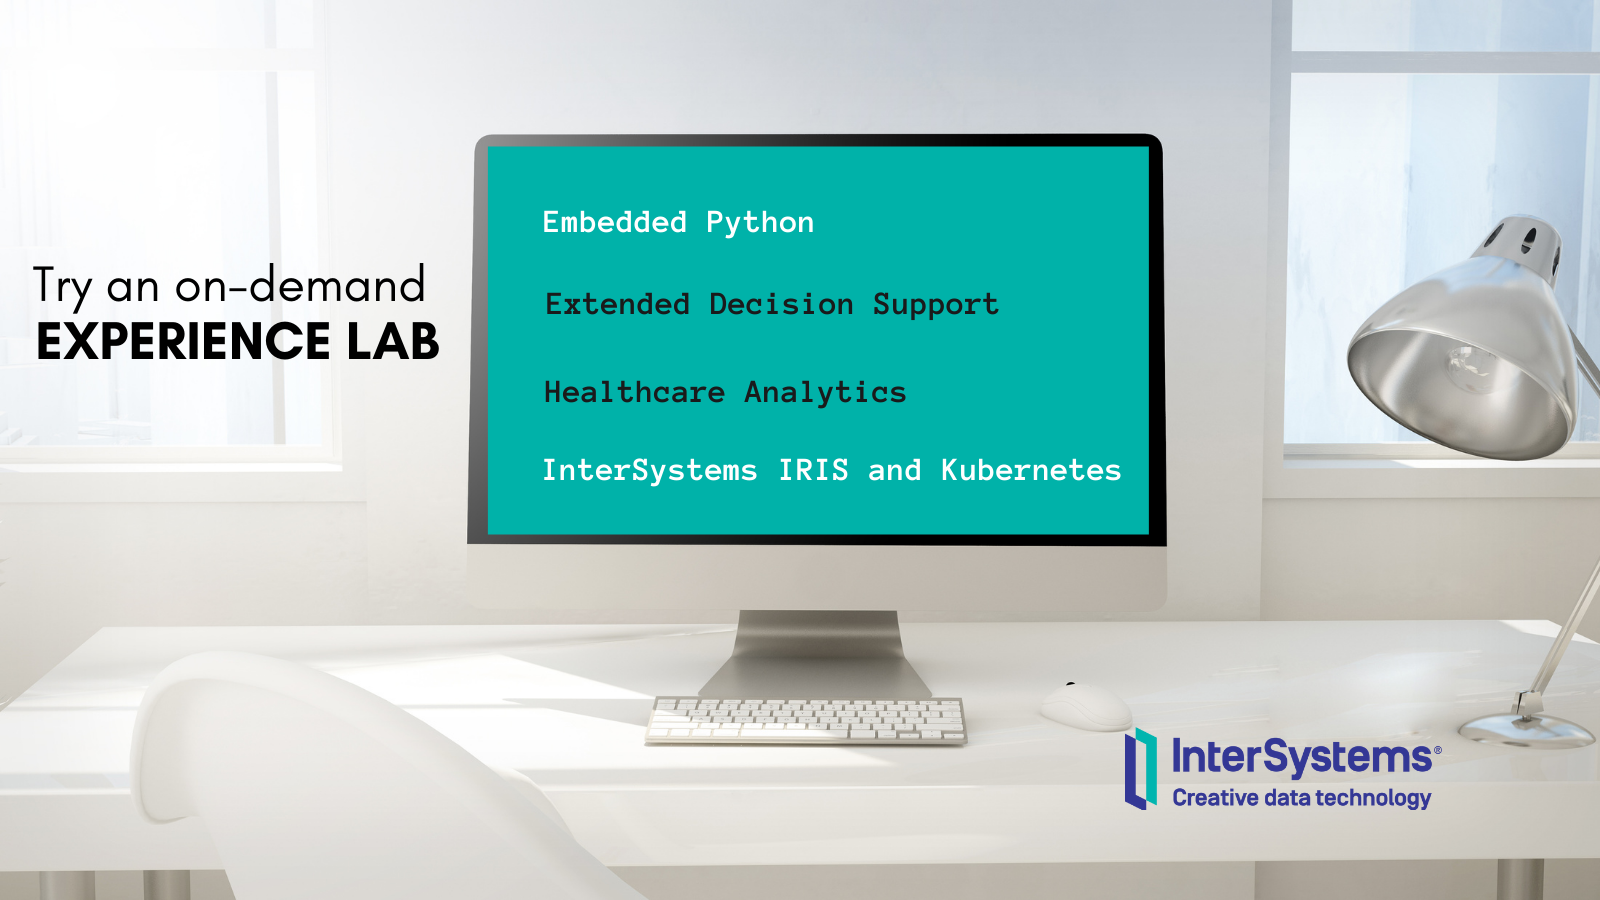
Did you catch an Experience Lab at the 2021 Virtual Summit? Head over to the InterSystems Learning siteto access all four of these hands-on exercises, and get up to speed on:
I'm happy to share with the community a web server log dataset from our longtime customer, an operating company.
Their webserver operates on Apache webserver and contains data which can be useful to analyse a load and search engines activity.
After installing the project, you will get the data for a few months that can show a typical load and activity of clients, robots and also you can see how it depends on day of week, holidays and time of a day.
The Cube is also included in package.
So you can use my previous project (Promjet-Stats) and see dataset in dashboards.
A full cycle project, from initial data initialization, daily update products from the official website, a service for sending a course on request and receiving a schedule for any period.
After installing the project, we will get a table of ruble exchange rates against the main currencies of the world established by the Central Bank of the Russian Federation for 2016-2021. Launching the product service with default settings will allow you to receive daily new exchange rates for the current day.
.png)
Hi Community,
In a hard work of data curation and data quality, the Health Dataset application deploy to you the above datasets.
These datasets can be used in your ML applications/models, AutoML and analytics projects. See more details here:
$ git clone https://github.com/yurimarx/automl-heart.git
Hi Community,
We're pleased to invite you to the upcoming webinar in Spanish called "Self-Service Analytics & Reporting"!
Date & Time: November 17, 4:00 PM (CET)
Speaker: @Alberto Fuentes, Sales Engineer, InterSystems Iberia

The webinar is aimed at Data Analytics or Business Intelligence professionals.
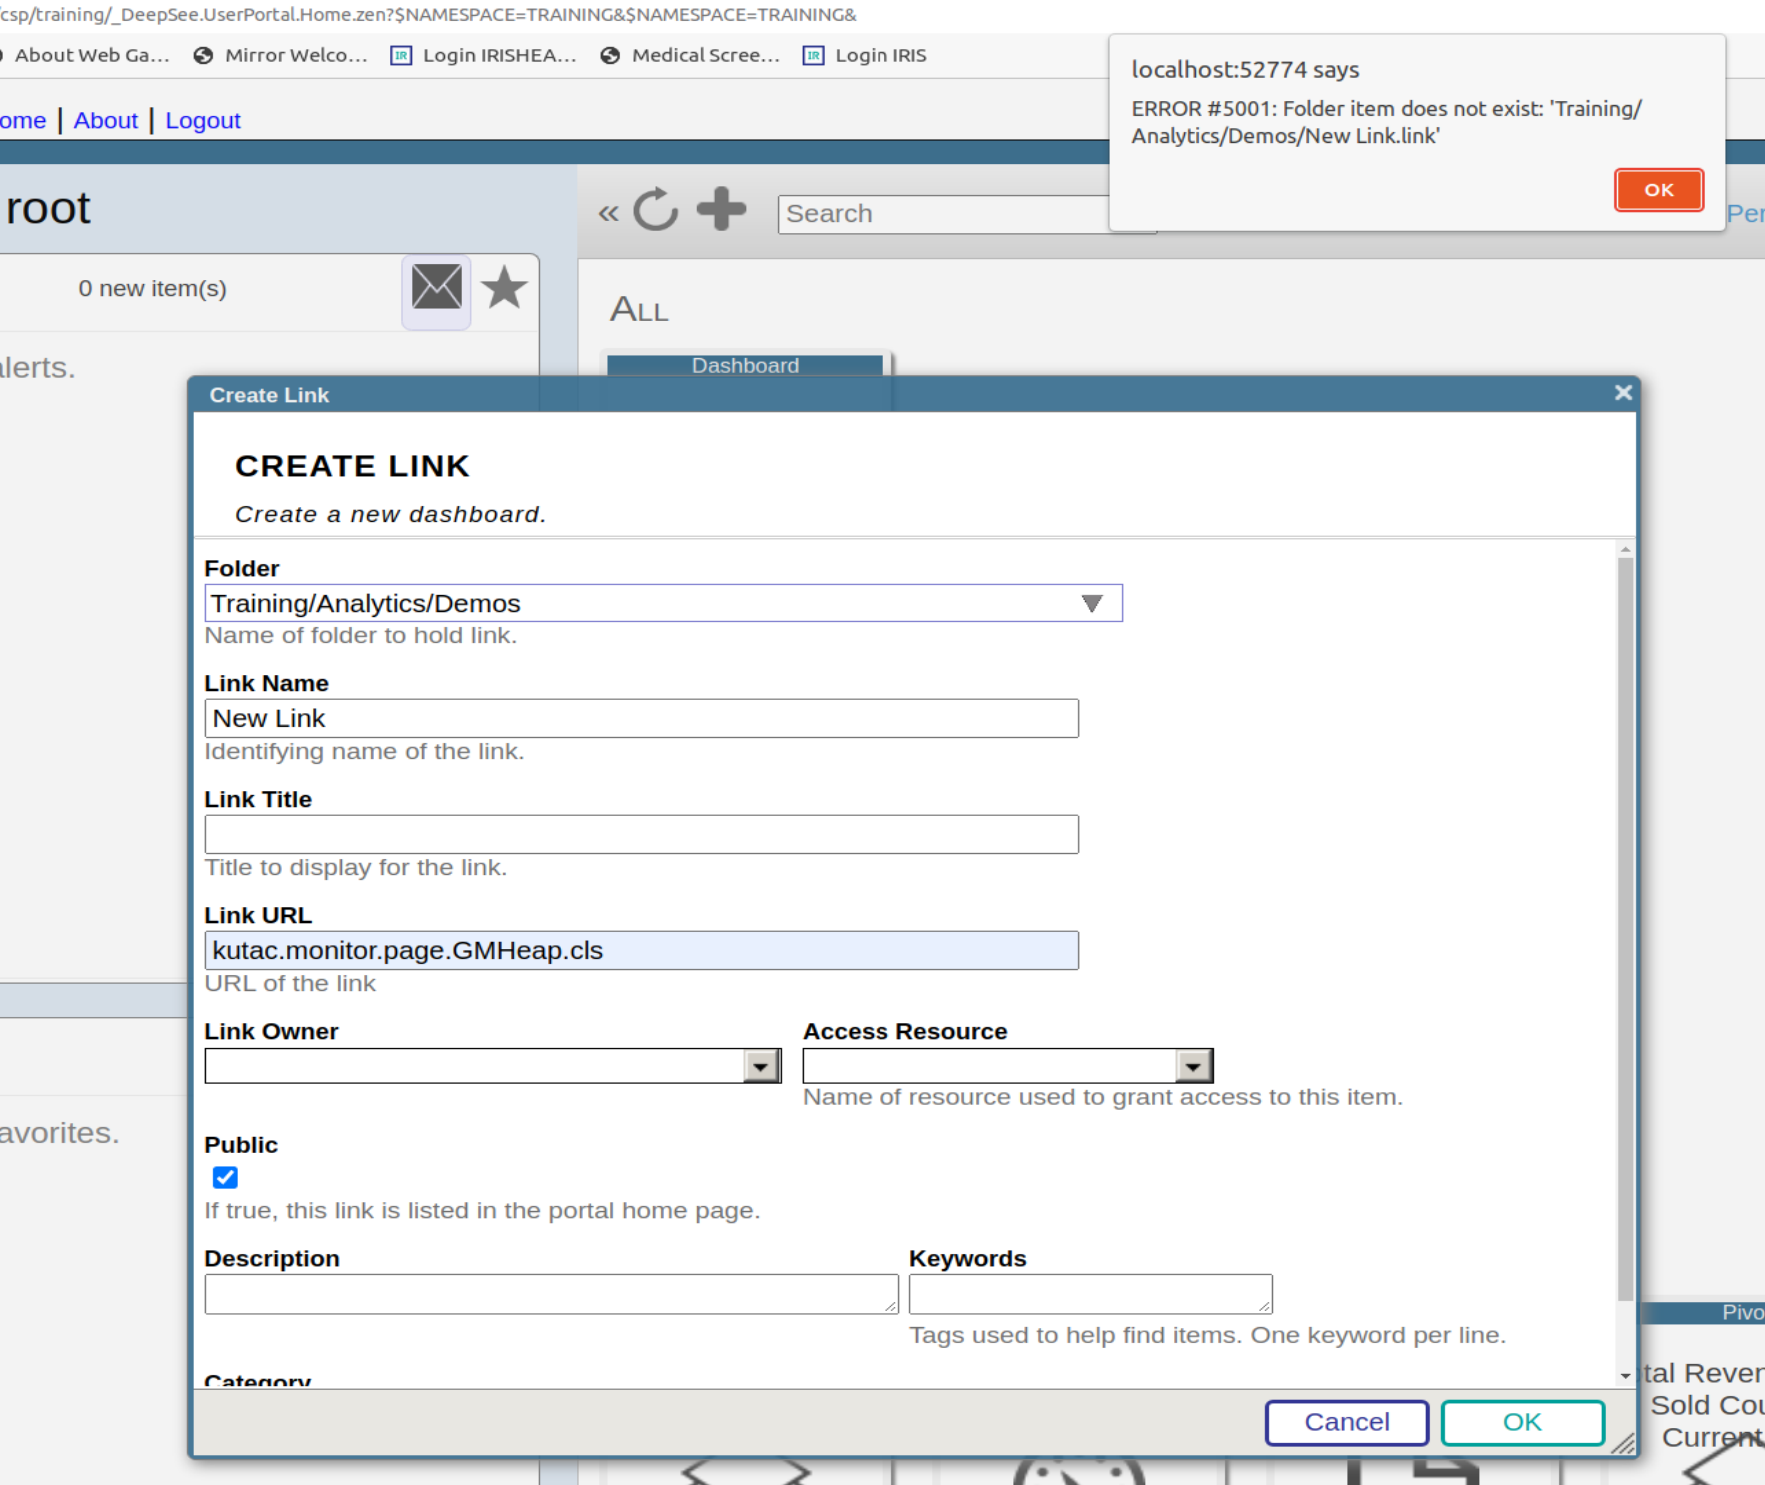
Hi, does anyone know how to add a LINK to an ANALYTICS DASHBOARD? I'm getting an error and until now I could not find anyhing in documentation.
thank you for help.
to be more specific: I need to figure out how to create a .LINK type of entry into a folder so I can add it to the dashboard.