I have this fact table
| CheckTime | Error | Marker (1 or 0) |
| 2019-01-01 00:01:00 | 1 | 0 |
| 2019-01-01 00:02:00 | 5 | 1 |
| 2019-01-01 00:03:00 | 2 | 0 |
And the cube which is pretty much 1:1.
I have build an MDX:
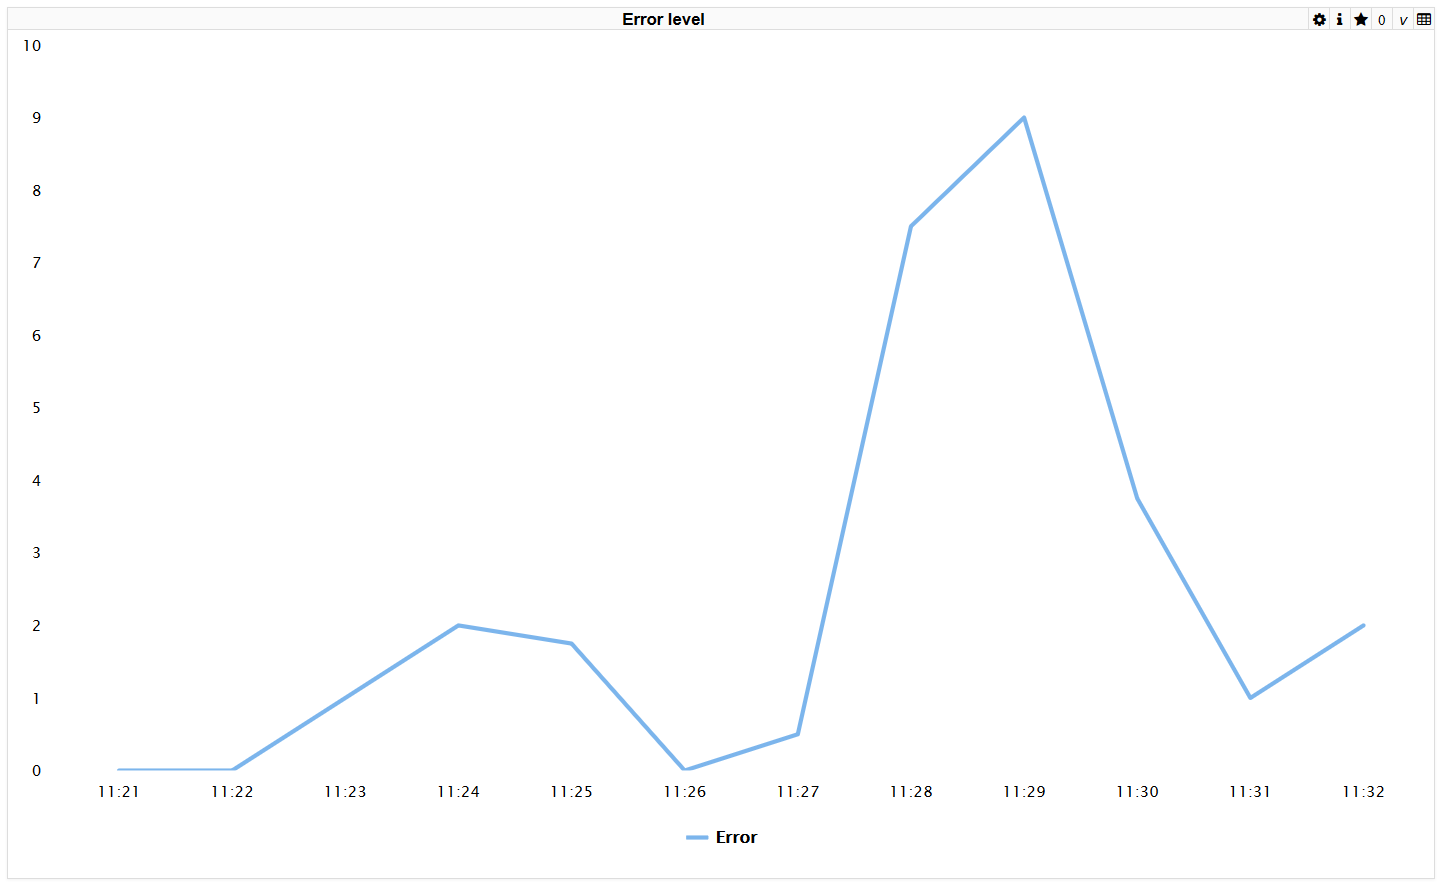
SELECT NON EMPTY [Measures].[Error] ON 0,NON EMPTY [CheckTime].[H1].[Minute].Members ON 1 FROM [CHECKCUBE]Which produced this chart in DeepSeeWeb (there's obviously more data, but you get an idea):
However, I want to add a Marker - if it equals 1 then I need some indication on the chart, so the graph should look like this:
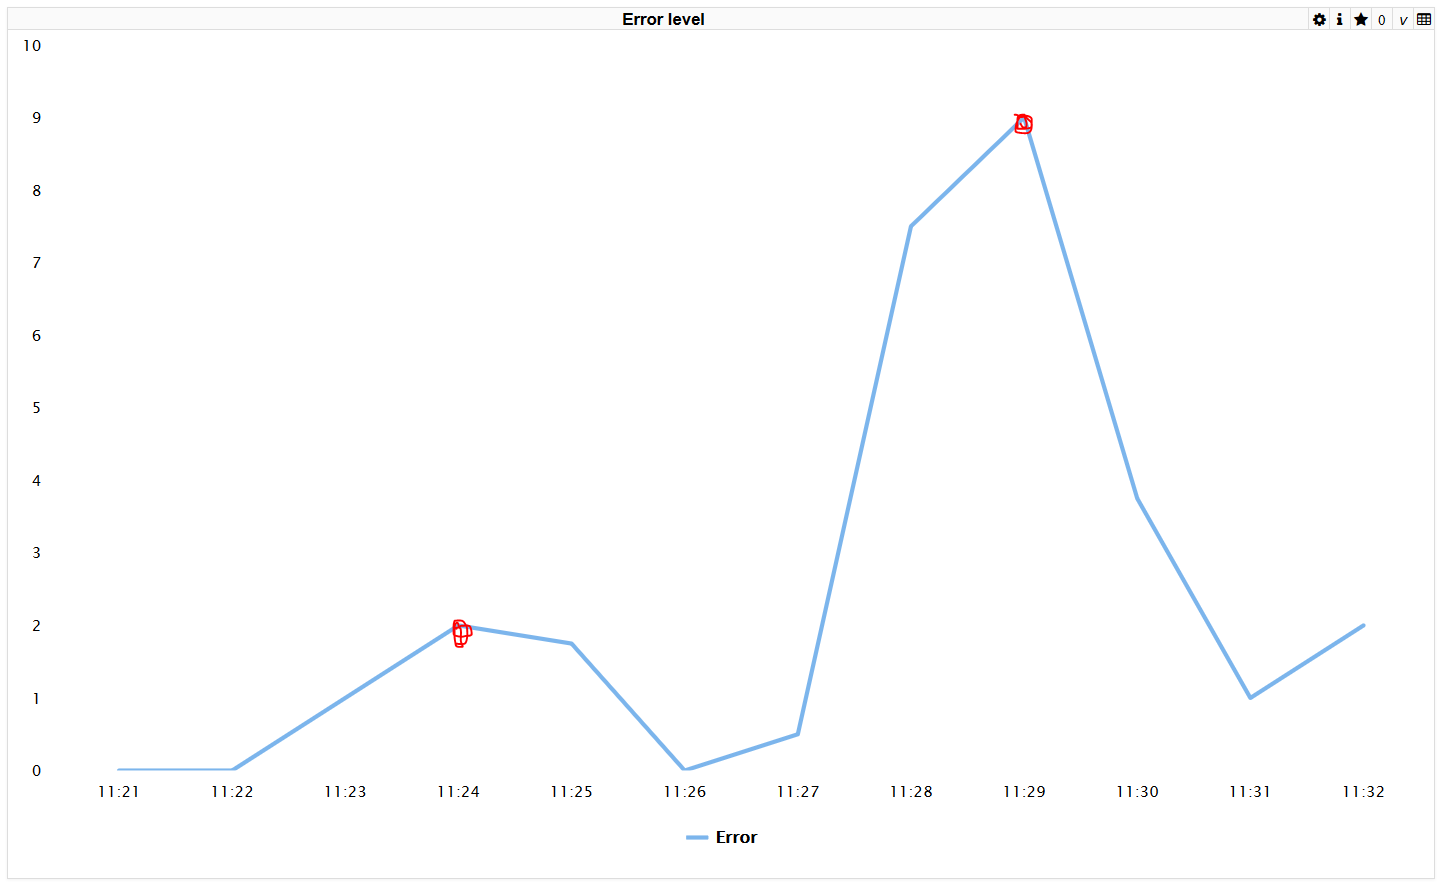
Is there a way to do that in DeepSee or DeepSeeWeb?

.png)
.png)