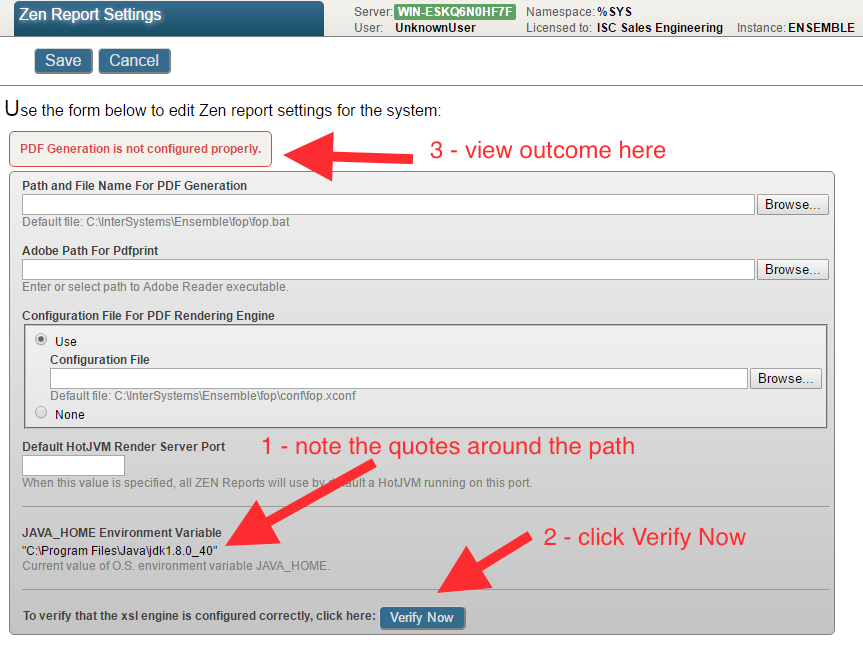
You may experience errors executing Java programs that rely on the JAVA_HOME environment.

For example when Create PDF from this pivot in DeepSee or in this case, outputting a Zen Report as PDF.

You can verify the PDF generation configuration by clicking on the Verify Now button on the Management Portal System > Configuration > Zen Report Settings page:

1 0
0 900

In the previous part of this series, we saw how to include data in a portlet from within DeepSee. This used the built in data controller. In this part, we are going to be pulling in data from outside of DeepSee. This will include both information from within InterSystems IRIS and from the OS.

Why use this?

This is useful if you would like to create a dashboard that only contains information about your system. It is also useful if you want to display data about your system along side data that you have stored in DeepSee.

2 0
0 358
Article
· Oct 27, 2016 1m read
Ensemble's Workflow Inbox portal

Hi - If you want to embed Ensemble's Workflow Inbox, (that offers workflow task items to workflow users) inside of your application - you can access the URL directly without necessarily giving users access to the Management Portal - but more importantly, you can strip away the Titlebar, Worklists and Borders that make up the page by default.

You do this by using the same URL parameters you would use, if embedding a regular DeepSee dashboard into your application.

For example, adding &EMBED=1 at the end of the URL as depicted below:

0 0
0 430

Preview Mode was added to InterSystems IRIS Business Intelligence to give designers a quick view of what their resulting Pivot Table will look like without needing to wait for the results to fully execute. This can be beneficial when designing pivot tables because if you are dragging and dropping elements to see how they look/work in your pivot table and seeing if they have the desired data. Since you are exploring and designing, you don't necessarily care about the results at the moment, but you would still like to see how your table looks with the changes you have made.

2 0
0 393
Article
· Aug 13, 2021 4m read
Building Analytics Solution with IRIS

Hi developers!

How to build an analytics solution with InterSystems IRIS?

To begin with, let's agree on the points of what is the analytics solution - and this could be a very wide topic. Let's limit the set of solutions to those you can present in the Analytics contest.

There are three kinds of analytics solutions that we will review here: monitoring, interactive analytics, and reporting.

Monitoring

The typical monitoring solution consists of an online dashboard with KPIs that are being actively updated.

The key use case is of monitoring is to visually observe the KPI of fresh data every moment to react in case of an emergency.

Interactive Analytics

This solution supposes a set of interactive dashboards with filters and drill-downs.

The key use case is to explore the data with filters and drill-downs making business decisions upon graph and table data visualization.

Reporting

Reporting solution provides a set of static (usually) reports in a form of HTML or pdf documents that deliver the data in graph and text form in a predesigned form and could be sent via email.

The typical use case of a reporting system is to obtain reports on a given period that will illustrate the status of the product, process, service, sales, etc that is crucial for the business.

How InterSystems products could be used to build such solutions? Let's discuss this below!

3 0
1 463

As said in the previous article about the iris-fhir-generative-ai experiment, the project logs all events for analysis. Here we are going to discuss two types of analysis covered by analytics embedded in the project:

2 0
1 262
Article
· Mar 2, 2020 2m read
SQL -99 error while viewing a listing

This error is sometimes seen while viewing a listing in InterSystems IRIS Business Intelligence:
ERROR #5540: SQLCODE: -99 Message: User <USERNAME> is not privileged for the operation (4)

As the error suggests, this is due to a permission error. To figure out which permissions are missing/needed, we can take a look at the SQL query that is generated. We will use a query from SAMPLES as an example.

1 0
0 1.2K

Previously I have already tried to play with Google Data Studio when I connected it to InterSystems FHIRaaS. It has quite a nice UI, with a few chart types available out of the box, it can be quite easily connected to some plain tables (stored as CSV or JSON, for instance), and gives the ability to build quite flexible analytics over it. So, I have decided to implement a new connector to InterSystems Analytics (DeepSee), with the ability to select a cube and do some queries on it.

3 0
0 362

When analyzing data, there is often a need to look at specific indicators more thoroughly and to highlight sections of information of particular interest to a user.

For instance, examining the data dynamics for specific regions or dates can help us uncover some hidden trends and patterns that will allow us to make an informed decision about our project in the future.

2 0
1 407

The DeepSee TroubleShooting Guide helps you track down and fix problems occurring in your DeepSee project. A common problem is finding less records than expected in a DeepSee Cube or a related Subject Area. The DeepSee TroubleShooting Guide suggests starting your investigation by checking the following:

Check cube for build restrictions

Check if maxFacts is used

Check if Build Errors are occurring

2 0
0 441

Introduction

Any election is a highly mysterious process, and when you look at its results, the overall picture is not quite clear. I decided to put them, region by region, on the map of Moscow using InterSystems technologies that offer both storage and data analysis functionality. In this particular case, I used InterSystems Ensemble, a platform for application development and integration, but you can also build this solution using the multi-model InterSystems Caché DBMS, as well as InterSystems’ new product called IRIS Data Platform.

3 0
0 776

Hi, Community!

This is the 3rd part of DeepSee Web story - Angular base UI for DeepSee Dashboards, see the beginning here.

By design, DSW provides an implementation for every widget in DeepSee library. But there are some extra features in DSW which make solutions built with DSW dashboards more functional. This article describes it.

2 0
1 1K

Hi Devs!

Last weekend I had been testing the newborn csvgen module and was looking for a CSV file to test - thus I came across an interesting datafile on Data.World with Game of Throne episodes statistics. Death statistics. These folks documented all the murders through all the 8 seasons and noted where, who, from what clan with what weapon had killed another one.

So I imported it and made an IRIS Analytics dashboard.

You Know Nothing, Jon Snow | You Know Nothing, Jon Snow | Know ...

Don't worry, Jon, with this dashboard we can figure out something ). See the details below.

6 0
2 718

What is Selective Build?

Selective Build is a BI feature in InterSystems IRIS (introduced in version 2020.1). Selective Build allows you to build specific elements of your cube while keeping your cube online.

What is special about Selective Build?

Before getting into the details of Selective Build, a brief recap of the different phases during a regular cube build is important. Here are the phases in a regular cube build:
1) Delete existing data in cube
2) Populate cube with full set of data
3) Build all indices in the cube

0 0
1 438

Why log in to view pivot tables when you can have them delivered directly to your inbox? Are you in need of automated reporting for InterSystems IRIS Business Intelligence? Pivot Subscriptions is your solution: a tool for subscribing to scheduled email reports of pivot tables inside InterSystems IRIS Business Intelligence (previously known as DeepSee).

6 0
1 557

Now available on Open Exchange is a library of third party charts available to use within DeepSee/InterSystems IRIS BI dashboards. To start, simply download and install, select the new portlet as the widget type, then select the chart type that you desire. If you don't find the type of chart you are looking for, you can easily extend the portlet to implement your desired chart type. These new chart types can be used within existing dashboards or you can create new dashboards using them.

4 0
0 1.1K

Power BI dashboards provide us with a good way to analyze aggregated information. We can even choose time periods for aggregation (you can find more details regarding it in our article about drill down). However, we might still be interested in a detailed look at specific data points. With the right data filling, we can display detailed data for any column of the chart with all filters applied to that chart.

1 0
0 1K
Article
· Sep 9, 2022 1m read
DC Analytics Open Application

InterSystems Developer Community analytics. Project made with InterSystems IRIS BI (DeepSee), Power BI and Logi Report Designer to visualize and analyze members, articles, questions, answers, views and other pieces of content and activity on InterSystems Developer Community.

You can see your own activity, articles and questions. Track how your contribution changes developer community.

2 0
0 300

Users of analytical applications often need to generate and send out PDF reports comprised of elements of the analytical panel. In the InterSystems stack, this task is solved using the DSW Reports project that is an extension of DeepSeeWeb. In this article, we will explain how to use DSW Reports for generating PDF reports and emailing them.

1 0
1 612

When we work with IRIS, we usually have the ability to quickly deploy a ready-to-use infrastructure for BI (data, analytical cubes, and IRIS BI dashboards) using modules. When we start using Adaptive Analytics, we typically want to have the same functionality. Adaptive Analytics has all the tools that we need. The documentation contains a description of how to work with an open web API. All interactions between the user interface and the engine also occur via the internal web API and can be emitted.

2 0
0 325