I like to use something like this:
select * from MyTable where MyFieldName like ‘%[^a-zA-Z0-9 !”%#$&”()*+,-./:;<=>?@]%’
to find field that contains special characters that are only allowed.
I like to use something like this:
select * from MyTable where MyFieldName like ‘%[^a-zA-Z0-9 !”%#$&”()*+,-./:;<=>?@]%’
to find field that contains special characters that are only allowed.
Hi Developers,
2019 was a really great year with almost 100 applications uploaded to the InterSystems Open Exchange!
To thank our Best Contributors we have special annual achievement badges in Global Masters Advocacy Hub. This year we introduced 2 new badges for contribution tothe InterSystems Open Exchange:
✅ InterSystems Application of the Year 2019
✅ InterSystems Developer of the Year 2019
We're glad to present the most downloaded applications on InterSystems Data Platforms!
Hi Developers!
Recently we published on Docker Hub images for InterSystems IRIS Community Edition and InterSystems IRIS Community for Health containers.
What is that?
There is a repository that publishes it, and in fact, it is the same container IRIS Community Edition containers you have on official InterSystems listing which have the pre-loaded ObjectScript Package Manager (ZPM) client.
So if you run this container with IRIS CE or IRIC CE for Health you can immediately start using ZPM and install packages from Community Registry or any others.
What does this mean for you?
It means, that anyone can deploy any of your InterSystems ObjectScript application in 3 commands:
It is safe, fast and cross-platform.
It's really handy if you want to test a new interesting ZPM package and not harm any of your systems.
Suppose, you have docker-desktop installed. You can run the image, which wiil pull the latest container if you don't have it locally:
Hi Developers!
Many of you are looking for samples on how to work with InterSystems IRIS Analytics, formerly known as DeepSee.
There is a Samples BI module with Patients and Holefoods examples which is available on Github with source code. The installation steps are clear but take time.
Recently we added the option to run IRIS Community Edition containers with ObjectScript Package Manager (ZPM) on board. This simplifies the installation to the "run-one-command" step for the modules submitted to ZPM Community Registry. And thus we can benefit the Samples BI installation with ZPM.
And here is how you can run it on your laptop. Let's go!
Happy new year! I’m Raj Singh, InterSystems’ product manager for Developer Experience and I’d love your feedback on how you use IDEs today and your thoughts for the future.
We understand you depend on a solid, intuitive and flexible IDE from InterSystems - whether you are an ObjectScript expert or new to it; whether ObjectScript is at the core of your applications, or you develop more in Java, Python, C# or Node.js.
Hi, Developers
When I click save button to save the new capturing information on cache server pages then following error pops up.
JavaScript exception was caught during execution of Hyper Event: Syntax Error: Expected.
Regards
Godfrey
I am trying to install Cache version 2018.1.0.184.0 on a Windows 10 System and i keep running into Permission errors during installation. I am getting
"Error 1406 Could not write value to key \SOFTWARE\Intersystems\\Classes\CLSID\{D11481CD-3B24-42E1-A20A-D179CDB6BEC5}\InstallCount"
I am signed in as an Administrator, i am running the installer as an administrator and i have edited permissions in the Registry to the referenced keys and i still can't get this to install. Has anyone run into this before and have some advice? I am pulling my hair out over here.
Any help is appreciated.
Hi All,
We have few queries which are simple selects . For simplicity let's say there is a query that joins two tables and gets few columns and both tables have no indexes.
Select Tab1.Field1, Tab2.Field2
From Table1 Tab1
Join Table2 Tab2
On Tab2.FK = Tab1.PK
When we do query plan for this it shows approx 6 million, however if we make a simple adjustment to the query
Select Tab1.Field1, Tab2.Field2
From Table1 Tab1
Join Table2 Tab2
On Tab2.FK = Tab1.PK
WHERE Tab1.Id > 0 (Which will always be the case)
The query plan comes down to few thousands. So approx 99% improvement.
Hi Developers,
New video, recorded by @Benjamin De Boe, is already on InterSystems Developers YouTube:
⏯ Python and InterSystems IRIS
Hello,
I have a record map and batch class being passed to an EnsLib.RecordMap.Operation.BatchFileOperation.
They are designated as INFORMATION.FPL.Record and INFORMATION.FPL.Header
After reaching the operation it errors out with this message : ERROR <Ens>ErrGeneral: Quitting with error on Message body 5@INFORMATION.FPL.Record / 54 because Status 'ERROR <EnsRecordMap>ErrNoBatchParent: Record with class 'INFORMATION.FPL.Record' and Id '54' doesn't belong to a batch' matched ReplyCodeAction 1 : 'E=F' resulting in Action code F
Some screen grabs are attached of my configuration.
Beginning with InterSystems IRIS 2020.1, the minimum required version for AIX is AIX 7.1 TL4.
The InterSystems IRIS installer will detect if the required IBM XL C filesets are installed before continuing
with the installation.
I currently have a batch job that performs many functions. Two of them are below. I was wondering how this can be done in a custom class
mv $TEMPDIR/$FILE $TEMPDIR/$FILEa"_$DATESTAMP.txt"
mv $TEMPDIR/$FILE1 $TEMPDIR/$FILE1a"_$DATESTAMP.txt"
mv $TEMPDIR/$FILE2 $TEMPDIR/$FILE2a"_$DATESTAMP.txt"
mv $TEMPDIR/$FILE3 $TEMPDIR/$FILE3a"_$DATESTAMP.txt"
mv $TEMPDIR/$FILE4 $TEMPDIR/$FILE4a"_$DATESTAMP.txt"
#Gzip files
find $TEMPDIR -type f ! -iname '*gz' -exec gzip '{}' \;
Thank you
This is a lesson learned, which I would like to share with community.
Recently I ran into an issue, where I was using %ConstructClone and it kept cloning extra records, which were not needed. The record for which I was trying to run a clone had many-to-one relationships.
The solution to this issue was using param -1. If you run %ConstructClone(-1) it will not clone relationships, but rather just clone single oref as desired in this case.
I hope this information helps someone who is working with similar records.
This series of articles would cover Python Gateway for InterSystems Data Platforms. Execute Python code and more from InterSystems IRIS. This project brings you the power of Python right into your InterSystems IRIS environment:
The plan for the series so far (subject to change).
The Jupyter Notebook is an open-source web application that allows you to create and share documents that contain live code, equations, visualizations and narrative text.
This extension allows you to browse and edit InterSystems IRIS BPL processes as jupyter notebooks.
Hello community,
I'm new to Objectscript and Intersystems development. I've read documentation and some examples and succeded to import my Java class file into HealthShare using the Java Gateway Service. To import my class i tryed both methods (Wizard, or scripting) with success.
Everything works great, i see my imported class inside the namespace, and i can call the methods.
The problem begin when i try to update my .JAR file with new methods. I've insert new methods inside my Java Class (Public methods), and build a new Jar file to import into HealthShare.
Working on a project to call a web service and the soap header has custom header elements that need to be signed. i reviewed the %soap.inc and didn't see any appropriate macro
EBS and IDP elements need to be signed
.png)
here's a provided header sample
this a sample output that I created.
my first pass was $$$SOAPWSIncludeDefault+$$$SOAPWSIncludeAddressing
How do I rename class programmatically?
This discussion touches on data move which, is not a concern in my case (BPL renames).
I also don't care about external references.
The best I got is:
Are there any better alternatives?
Also found this discussion.
Hi Community,
2019 was a great year full of video content for InterSystems Developers. Already 200 Videos on our InterSystems Developers YouTube Channel, and the number of subscribers has doubled since the previous year!
Almost 57K Views and 5,1K hours of Watch Time in 2019! Thank you, our dear subscribers, so we understand that our video channel is valuable to you!
Now let's take a closer look at the most popular videos on InterSystems Data Platforms over the past year.
| Top 10 Videos by Views in 2019 | |||
| № | Video | Views | Watch Time (hours) |
| 1 | 12 988 | 778,7 | |
| 2 | SMART on FHIR: The Basics | 6 807 | 1 134,9 |
| 3 | Building Modern Web Applications | 6 733 | 570,5 |
| 4 | Developing with FHIR - REST APIs | 2 072 | 225,6 |
| 5 | Create Your First InterSystems ObjectScript Code with IRIS Community, GitHub, Docker and VSCode | 1 093 | 53,8 |
| 6 | Sizing and Capacity Planning | 1 019 | 92,4 |
| 7 | REST API Design and Development | 890 | 84,4 |
| 8 | InterSystems Developer Community and Global Masters | 886 | 7,1 |
| 9 | Editing and Compiling ObjectScript using VSCode | 698 | 22,8 |
| 10 | Introducing InterSystems IRIS Data Platform | 674 | 90,8 |
We want to be able to dispatch based on the IP address who connected to a TCP Inbound adapter.
The address is in ..Adapter.%outIPAddr when the connection is made and reported with $$$LOGINFIO() but by the time OnProcessInput() is called the value is blank.
When I tried to migrate one of ZEN applications to IRIS from 2018.1 I'm faced with the issue with Login Page, in this case used some ZEN page, completely customized. But when a user tries to get access, he gets the error like below.
The requested URL /csp/user/User.Login.cls was not found on this server.
I tried to test it with a fresh just created login page class
Class User.Login Extends %CSP.Page
{

ClassMethod OnPage() As %Status
{
  &html<<h1>Hello</1>>
  Quit $$$OK
}

}
Set it to /csp/user application as Login page, and
When I change my Login class to
cache 2017.2.1 (Build 801_3)
when I look into the "sql statements" ( sql page of the management portal ) I have lots of old statements with a lot of them frozen. many of them are %sqlcq routines (I believe these are the SLQ's I run when testing/running random SQL queries in the sql page. )
I can clearly see where I can click on an individual query and untick an individual query to unfreeze it. or delete it. but thats a painful slow process.
Hi Developers!
Often when we install a code package we want to make some post-install settings, e.g. call to a method, set up a configuration file.
This article describes how to do this with the ObjectScript Package Manager.
To make any post-install calls you need to add <Invoke> elements into <Invokes> tag to the module.xml. Each <Invoke> element can have nested <Arg> elements if you want to pass params to the method:
<Invokes>

<Invoke Class="Class.Name1" Method="MethodName1">

<Arg>Sting Value</Arg>

<Arg>123</Arg>
</Invoke>

</Invkoes>
Here is an example module.xml
Hi Community,
Please welcome the new video on InterSystems Developers YouTube Channel:
⏯ Operationalizing "Machine Learning" Experiences From the Field
Hi Developers!
I'm pleased to announce that ObjectScript package publishing is now generally available on Open Exchange with this November 2019 release!
If you want your ObjectScript application to be published in ObjectScript Package Manager just enable "Publish in Package Manager" option:
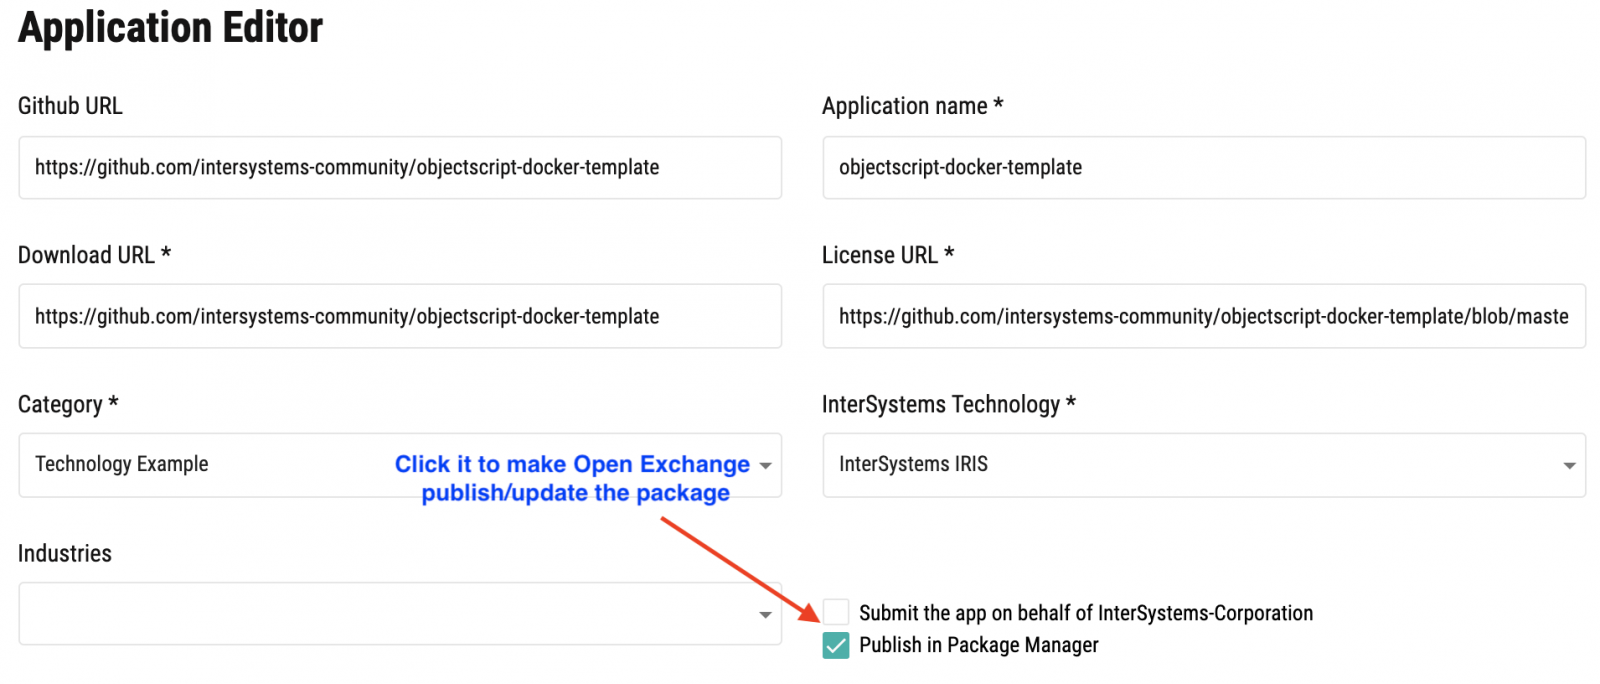
And send the app on approving.
Once the application is approved it will be published automatically in ObjectScript Package Manager Registry and will be available for installation via ZPM client.
See the details below.
I would like a REST client to be able to send a custom header with the http request, for example "APPLICATION-ID".
This can be seen in the CSP gateway trace but I have tried using %request.GetCgiEnv("HTTP_APPLICATION-ID") in various formats and parts of the classes but cannot work out where I can get this. Documentation says this should work but is for normal CSP pages.
Any ideas?
Is there a way to get dynamic object from iterator?
set arr=[1,2,3]
set iter=arr.%GetIterator()
I pass iterator several frames down and I'd rather avoid passing both the array and iterator, but for debugging I need to access original object in a situation where only iterator is available.
Is there a way to do it?
This repository is a go-public that builds on the already existing InterSystems-internal Convergent Analytics community and InterSystems-private MLToolkit repo (remains active and contains the most recent information for external ML Toolkit users - request memebership by writing us at MLToolkit@intersystems.com). This repo embraces more than ML Toolkit, we would like to host any discussions, publications, projects that add up in what we call convergent analytics approach. Welcome!
I have to write a DTL with the Data Transformation Builder to convert messages from HL7 ORU R01 v2.1 to HL7 ORU R01 v2.5. The incoming messages contain a text in OBX-5. This text contains LF characters (only LF - Segment separator is CR). Therefore it is not possible to parse the incoming message. While testing the transformation the OBX Segment ends at the first occurence of LF. Is there a way to replace the LF character before parsing?
In the previous part of this series, we saw how to include data in a portlet from within DeepSee. This used the built in data controller. In this part, we are going to be pulling in data from outside of DeepSee. This will include both information from within InterSystems IRIS and from the OS.
This is useful if you would like to create a dashboard that only contains information about your system. It is also useful if you want to display data about your system along side data that you have stored in DeepSee.