Announcement
· Aug 20, 2020
SQL Monitoring survey

Hi,

As part of our continuous efforts to expand and improve the InterSystems IRIS Data Platform, we’ve set up a brief survey around SQL monitoring. Your feedback will help us in designing and developing the right tools for the job and improve the platform’s overall ease-of-use. Please use the link below to access the survey, which should only take around 5 minutes to complete.

0 0
0 215

Presenter: Kerry Kirkham
Task: Prevent application-to-application interface problems from escalating
Approach: Give examples of using alerts to get the right person working on a problem as soon as possible

Problems with application-to-application interfaces are inevitable but in most cases they can be fixed with little disruption as long as the right person gets to know about it as soon as possible. But delays in attention cause problems to escalate, pressure mounts and business suffers. This session looks at how monitoring and alerting can be set up to recognize problems and get the right person working on the problem in the shortest possible time so that small problems don’t turn into major issues.

Solution: Using alerts to minimize interface problems

Content related to this session, including slides, video and additional learning content can be found here.

0 0
0 297

Hi Community!

Please find the Developer Community video of the week:

Monitoring : Don't Turn a Drama into a Crisis

https://www.youtube.com/embed/T_RK5QzRZ0Q
[This is an embedded link, but you cannot view embedded content directly on the site because you have declined the cookies necessary to access it. To view embedded content, you would need to accept all cookies in your Cookies Settings]

2 0
0 282

Presenter: Luca Ravazzolo
Task: Track the status and performance of clustered environments
Approach: Give examples of using modern technology to spot potential bottlenecks before they turn into problems

This session will discuss how modern technology can be used to keep track of the status and performance of your cloud clustered environments.

Content related to this session, including slides, video and additional learning content can be found here.

0 0
0 278

Presenter: Barry Cooper
Task: Enable users to perform analytics within an application and take actions based on those analytics
Approach: Provide examples of embedding DeepSee within applications

Analytics is more than just using data to provide insight. Analytics is about taking action on that insight. See examples of how you can embed DeepSee in your applications, allowing you to take action.

Content related to this session, including slides, video and additional learning content can be found here.

0 0
0 162

Hi Community,

The new video from Global Summit 2019 is already on InterSystems Developers YouTube:

⏯ Understanding System Performance Metrics

https://www.youtube.com/embed/4k9Qsc_HW7g
[This is an embedded link, but you cannot view embedded content directly on the site because you have declined the cookies necessary to access it. To view embedded content, you would need to accept all cookies in your Cookies Settings]

0 0
0 207

Hi Community!

The new video from Global Summit 2019 is already on InterSystems Developers YouTube:

System Alerting and Monitoring Made Easy

https://www.youtube.com/embed/XtXzvN3Gqgw
[This is an embedded link, but you cannot view embedded content directly on the site because you have declined the cookies necessary to access it. To view embedded content, you would need to accept all cookies in your Cookies Settings]

1 0
0 276

Welcome to the next chapter of my CI/CD series, where we discuss possible approaches toward software development with InterSystems technologies and GitLab.
Today, we continue talking about Interoperability, specifically monitoring your Interoperability deployments. If you haven't yet, set up Alerting for all your Interoperability productions to get alerts about errors and production state in general.

Inactivity Timeout is a setting common to all Interoperability Business Hosts. A business host has an Inactive status after it has not received any messages within the number of seconds specified by the Inactivity Timeout field. The production Monitor Service periodically reviews the status of business services and business operations within the production and marks the item as Inactive if it has not done anything within the Inactivity Timeout period.
The default value is 0 (zero). If this setting is 0, the business host will never be marked Inactive, no matter how long it stands idle.

This is an extremely useful setting since it generates alerts, which, together with configured alerting, allows for real-time notifications about production issues. Business Host being idle means there might be some issues with production, integrations, or network connectivity worth looking into.
However, Business Host can have only one constant Inactivity Timeout setting, which might generate unnecessary alerts during known periods of low traffic: nights, weekends, holidays, etc.
In this article, I will outline several approaches towards dynamic Inactivity Timeout implementation. While I do provide a working example (currently running in production for one of our customers), this article is more of a guideline for building your own dynamic Inactivity Timeout implementation, so don't consider the proposed solution as the only alternative.

5 0
0 1.1K

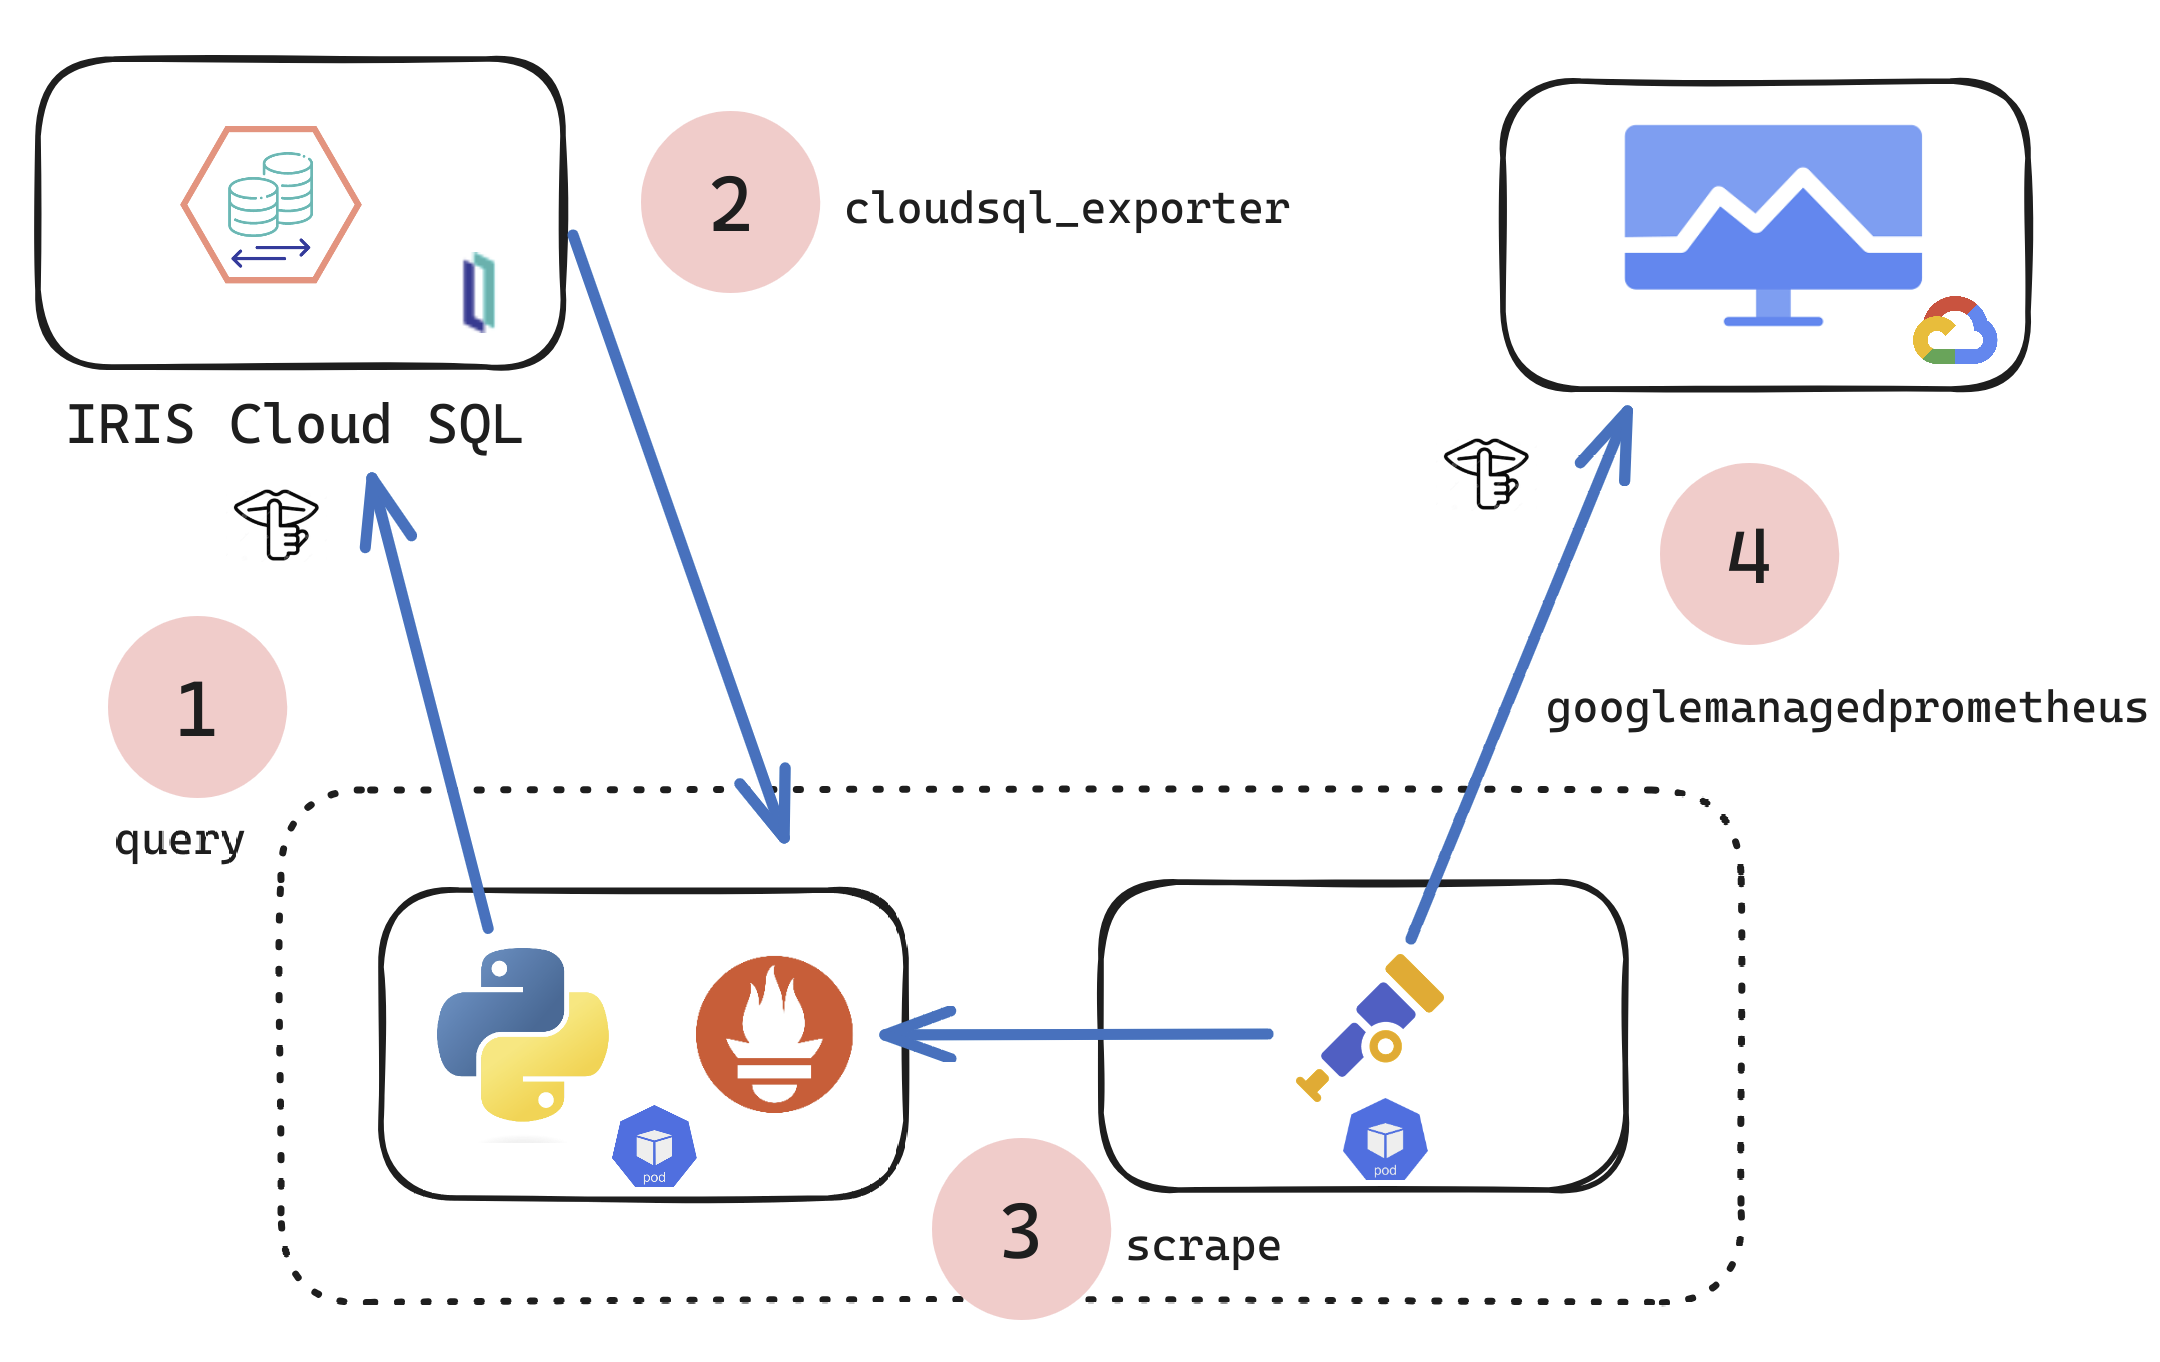
If you are a customer of the new InterSystems IRIS® Cloud SQL and InterSystems IRIS® Cloud IntegratedML® cloud offerings and want access to the metrics of your deployments and send them to your own Observability platform, here is a quick and dirty way to get it done by sending the metrics to Google Cloud Platform Monitoring (formerly StackDriver).

11 0
2 123

Hi Community,

This article assumes that you are familiar with Zabbix and SNMP monitoring, if not, there are some very interesting posts on the Community, especially this one (https://community.intersystems.com/post/creating-custom-snmp-oids) which contains a lot of information on how to configure and request an SNMP Cache server.

6 0
0 6.7K

Hey Developers,

Please welcome the new video on InterSystems Developers YouTube:

System Alerting & Monitoring

https://www.youtube.com/embed/EYLHIEAxHLk
[This is an embedded link, but you cannot view embedded content directly on the site because you have declined the cookies necessary to access it. To view embedded content, you would need to accept all cookies in your Cookies Settings]

3 0
1 305

Hello,

Our team is working on building dashboard for internal reference and monitoring.

We would like to have details like Interface Name, Current Status, Last Messages Processed at, IP & Port, Serve/Instance/Production Environment name etc.

If there is any built-in service which we can utilize or any pre-compiled code that we can utilize to build such dashboard.

At this moment want to keep it basic, but moving forward will enhance with more advance features.

Please suggest, any help will be appreciated.

Thanks,

Yash

0 0
0 194

Hi Developers,

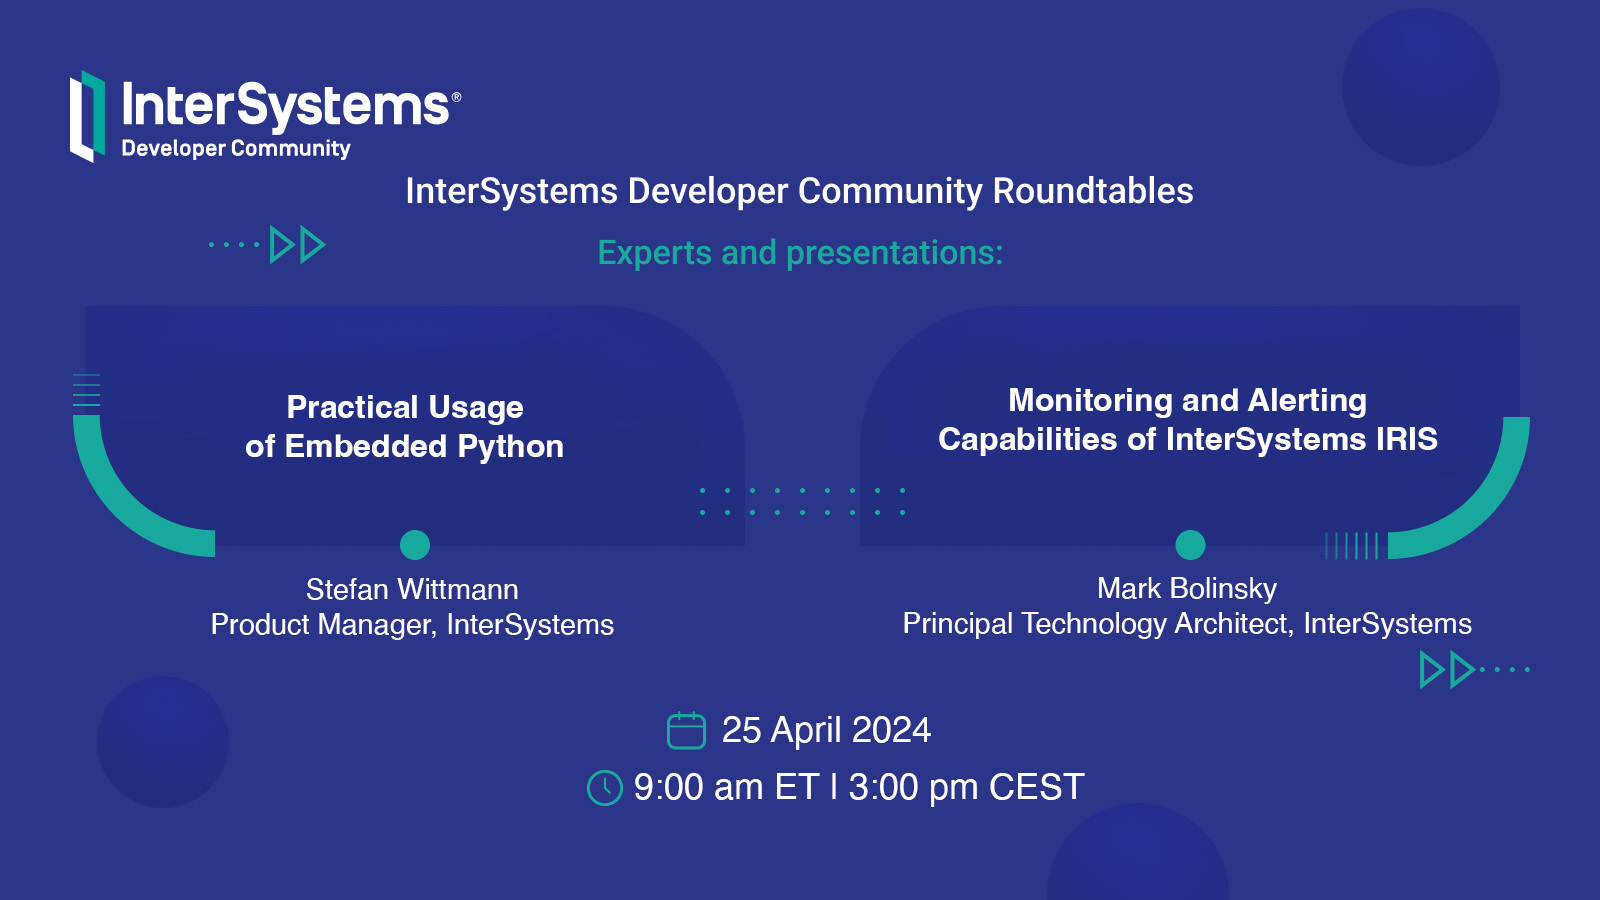
Join us at the upcoming Developer Roundtable on April 25th at 9 am ET | 3 pm CET. 📍
We will have 2 topics covered by the invited experts and open discussion as always.

Tech Talks:
Practical Usage of Embedded Python - by Stefan Wittmann Product Manager, InterSystems
Monitoring and Alerting Capabilities of InterSystems IRIS - by Mark Bolinsky, Principal Technology Architect, InterSystems

Register via >> this Global Masters challenge <<
Please note: access to the roundtable requires registration as an attendee.

1 0
0 95

Hi All,

With this article, I would like to show you how easily and dynamically System Alerting and Monitoring (or SAM for short) can be configured. The use case could be that of a fast and agile CI/CD provisioning pipeline where you want to run your unit-tests but also stress-tests and you would want to quickly be able to see if those tests are successful or how they are stressing the systems and your application (the InterSystems IRIS backend SAM API is extendable for your APM implementation).

4 0
1 647