Hi!
Sometimes I need to filter the widget on a dashboard from a different cube. And I face the following problem:
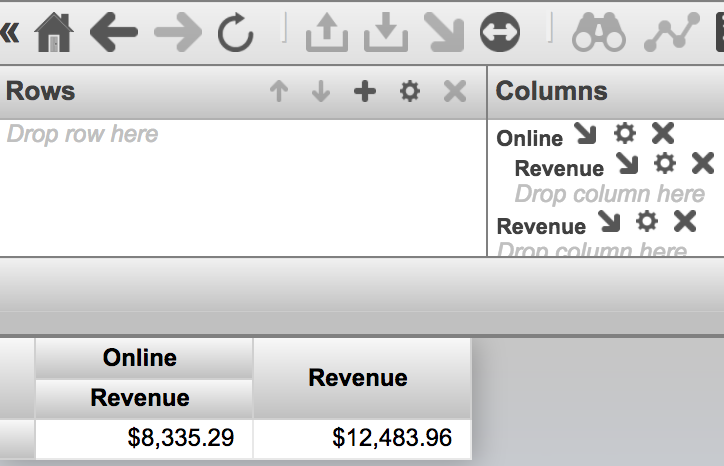
Widget A refers to a query from Cube A and I want to filter Widget B from Widget B.
Widget's B pivot refers to Cube B, and which has different dimensions for the same data.
E.g. cube A has the dimension Author and the Cube B has the dimension Member for the same data. So there is no way to filter such a widget B from the widget A.