New
Hi community.
How do i count distinct values over cumulative date dimension?
I got calculated measure function defined in cube: COUNT([dimension].[H1].[dimension].Members, EXCLUDEEMPTY)
[dimension].[H1].[dimension] = non-unique numerical fields of ids
Then i got AGGREGATION function defined in Analyzer (that stored in ^DeepSee.CalcMbrs):
AGGREGATE(%TIMERANGE(TimeDimension.hierarchy.level,TimeDimension.hierarchy.level.CurrentMember),Measures.Measure)This return an error:
ERROR #5001: No member provider object found for member function: MEMBER(5)All syntax is correct. I checked it twice.
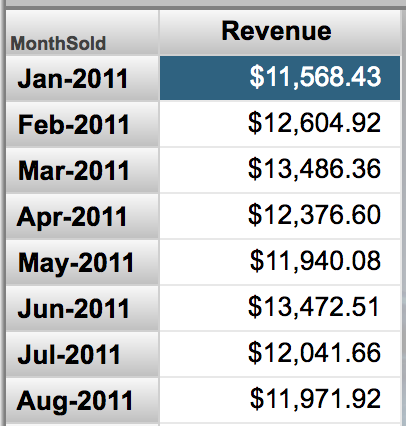
.png)