This tag relates to the discussions on the development of analytics and business intelligence solutions, visualization, KPI and other business metrics management.
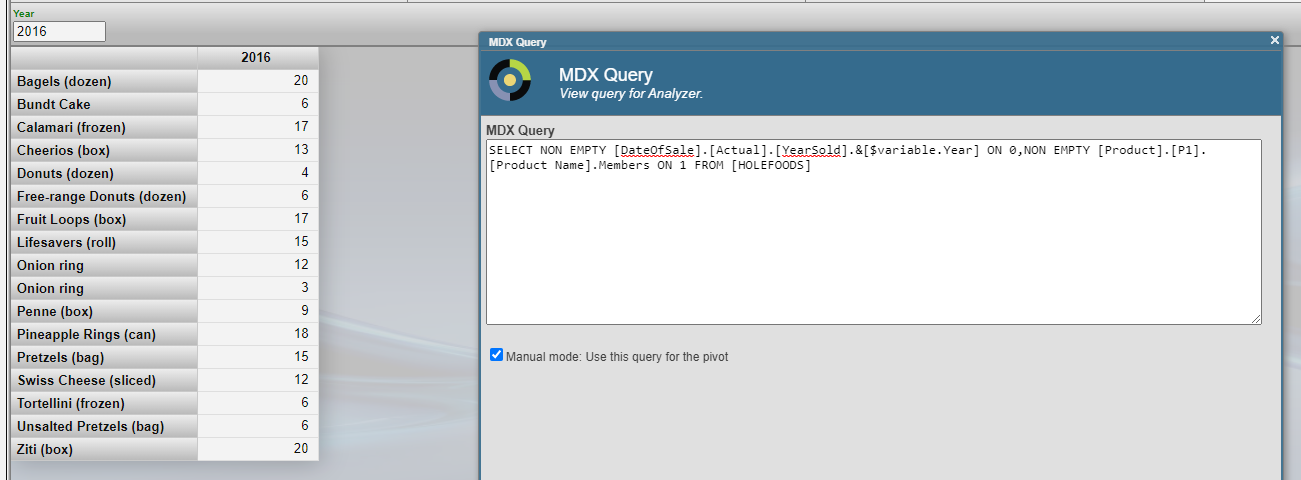
Hi there, We need your help, in the build pivot with DMX, we don't can run the pivot. The MDX use is:
WITH MEMBER [Measures].[CondicionesContCompleta] AS ( IIf([Measures].[CondicionesContCompleta] = Null, 0,[Measures].[CondicionesContCompleta] ) ) SELECT NON EMPTY ( [Gerencia].Gerencia].[Gerencia] ) ON ROWS, NON EMPTY ( [Measures].[CondicionesContCompleta] ) ON COLUMNS FROM [Condiciones]
and when we executed the pivot display the next dialog.
Error#5001: Expected operator within tuple: ('SELECT' @pos 156)(2)
I have a series of data organized by time (year and month) so I can use a time dimension to drill down data. So far so good.
However, I need to display the data not by calendar years and months but rather by seasons. The season has 12 calendar months but starts in September. So I'd like to see the data from September / Year N to August / Year N+1 using the same hierarchy as normal time dimension.
Has anyone done something similar?
Obviously, the season can start by any month, not only September :)
We have created a custom SDA container to store a certain kind of new, customized patient data.
We are observing a behavior in the correspoding analytics table for this custom SDA class where rows are added for a patient for which the MPI is null and the patient record does not exist.
i'm trying to extend both the MemberEnrollment and the MedicalClaim objects in HS. The CareProvider is perfect for some of my extensions (Operating provider, referring provider, third-party insurer), but the documentation says https://docs.intersystems.com/irisforhealthlatest/csp/docbook/DocBook.UI...
I have a method like this and I want to be able to see the results on the terminal, how do I run this method on a terminal to display the results of this SQL query?
The row expression defines what dimensions and measures appear on the rows of your pivot table as well as how they appear. Sets and CROSSJOINs are used.
I work on an ERP system and am trying to set up a dashboard according to a customer request. It's a pivot table with a few controls and filters, nothing too difficult, but I'm having some issues with drill down.
I have 3 simple tables: Encounter, Patient and Immunizations. Encounter makes a reference to Patient, and Patient contains a list of Immunization objects.
I've tried using PowerBI to access IRIS (using ODBC connector, not InterSystems BI connector), PowerBI reports the error:
Expression.Error: The column 'Patient' of the table wasn't found.
Details:
    Patient
it does this for two of the three tables I need only (Patient and Encounter), but not for Immunization IRIS table..
The >/</= etc. operands in named filters are great... except they won't work with measures ('native' or calculated - and what a boon it would be if they could work with both).
Are there any plans to add this capability?
And are there any plans to have a 'named filter' control within widgets that would let you change the operand?
When we have to predict the value of a categorical (or discrete) outcome we use logistic regression. I believe we use linear regression to also predict the value of an outcome given the input values.
Then, what is the difference between the two methodologies?
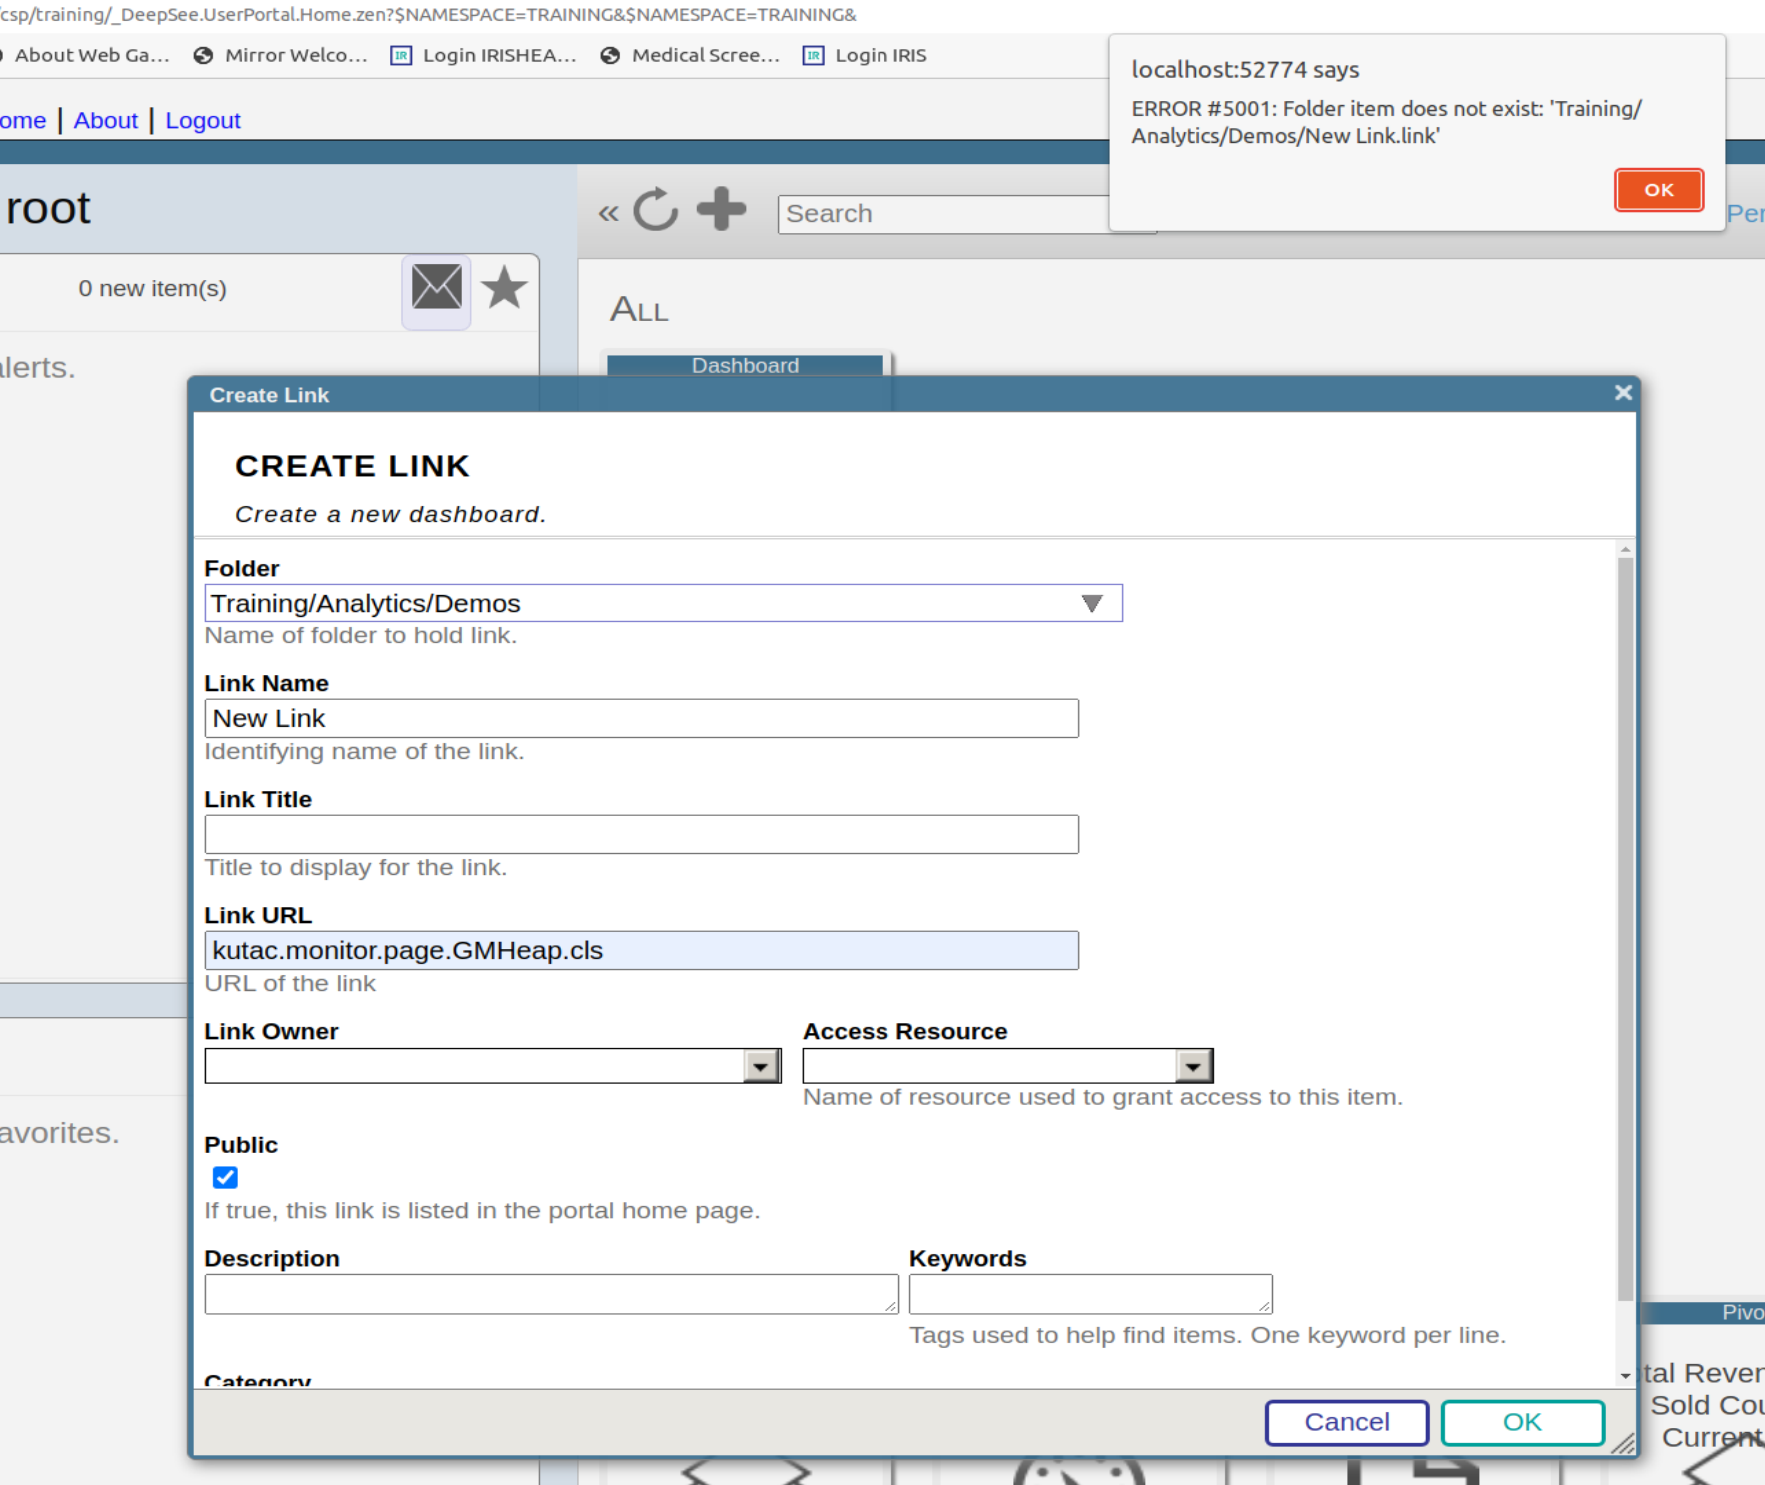
I have recently studied deepsee and developed few dashboards needed for our web app users. I am trying to embed them in our existing web app which uses angular with delegated user access. I need to embed the native IRIS dashboard into it. ( I can't use Highcharts or any other js tools).
How do I setup the dashboards to work with delegated authentication (Without providing access to management portal or other parts) ? Also should I use the default csp/{Namespace}/_DeepSee.UserPortal.DashboardViewer.zen? or any other web application URL ?
I am working with InterSystems IRIS and seeking guidance on how to perform specific tasks related to the FHIR SQL Builder using commands or code, rather than the graphical user interface (GUI). The specific tasks I am trying to accomplish are:
When creating pivots in DeepSee, there is the ability to group date dimensions by Day, Week, Month, Quarter, Year. For some of our reporting the Week option is desired. However the display looks like the image shown below. Notice the "YYYYW##" formatting.
Is there any ability within DeepSee to modify the display of grouped week dates? E.g. instead of 2020W14 it could be 03/30/2020-04/05-2020, or even just the start or end date, etc.
Hi, I'm new to the Analytics world in Intersystems and was attempting to print and/or export selected rows from a detail listing in a pivot on a dashboard. I am able to print and/or export all the rows; but if I select a specific set of rows, it prints out the entire detail listing; not the selected rows. Please advise on the best approach to accomplish this task. Thanks.
 By views
.png)
.png)
.png)
.png)